3 What good is goodness? The effects of reference points on discrimination and categorization of shapes
Van Geert, E., & Wagemans, J. (under review). What good is goodness? The effects of reference points on discrimination and categorization of shapes. Preprint available from: https://doi.org/10.31234/osf.io/6x75c
Preprint Interactive figures Materials, data, and code
Garner (1974) posed the question “What good is goodness?” in the second chapter of his book ‘The Processing of Information and Structure’.
Abstract
Earlier research reported a category boundary effect on perception: Differences between stimuli belonging to the same category are perceived as smaller than differences between stimuli belonging to different categories even when the physical dissimilarity between the stimuli in the pairs is the same. In this paper, we propose that the existence of reference points (i.e., exemplars that serve as a point of comparison) can explain the occurrence of the category boundary effect as well as the directional asymmetries in within-category pairs. We investigated how reference points influence categorization and discrimination performance, using three different tasks: categorization, successive discrimination, and similarity judgment. We used both recognizable and non-recognizable morph figures as stimuli, assuming that recognizable series have clearer reference points. We replicated the overall category boundary effect for both discrimination and similarity and show the effect’s dependence on the strength of the reference points involved. The general category boundary effect is not a proper category boundary effect, however: rather than the type of stimulus pair presented (i.e., within- or between-category) one needs to take into account the distance from the reference points for each of the individual stimuli in the pair to actually predict discrimination performance and similarity judgments. These results provide evidence that reference points on a dimension and their strength have tangible consequences for how we perceive, categorize, and react to stimuli on that dimension. Moreover, our findings remind us of the danger of averaging without looking at underlying data patterns, and of the gains that can be made by seriously exploring consistent variability in extensive data sets.
Reference points, categorization, and discrimination
3.1 Introduction
For many decades, psychologists acknowledge the importance of using psychological rather than physical scaling when assessing similarity between stimuli or differences in reactions to stimuli (Fechner, 1860; Shepard, 1987). Recent work also discusses the importance of using psychological scaling rather than physical scaling in explaining several types of human functioning, performance and behavior (e.g., Schurgin et al., 2020; Sims, 2018). In most of this previous literature, psychological scaling has been used as an explanatory variable, but it is less often considered which factors – besides physical (dis)similarities – influence the formation and dynamic adaptation of these psychological scales. The existence of reference points (i.e., exemplars that serve as a point of comparison, in relation to which we perceive other exemplars of that category) may be an important factor in the formation and dynamic adaptation of categories, and consequently, in the formation of psychological scales.
In what follows, we first explain in more detail how categories can influence psychological similarity, with a particular focus on the well-known ‘category boundary effect’. We then dive into potential explanations for the existence of this effect and show how the tendency towards reference points can explain the existence of the category boundary effect as well as directional asymmetries that are sometimes found when studying the category boundary effect. At the end of this introduction, we discuss the goals of the current empirical study in more detail.
3.1.1 Categorization and the category boundary effect
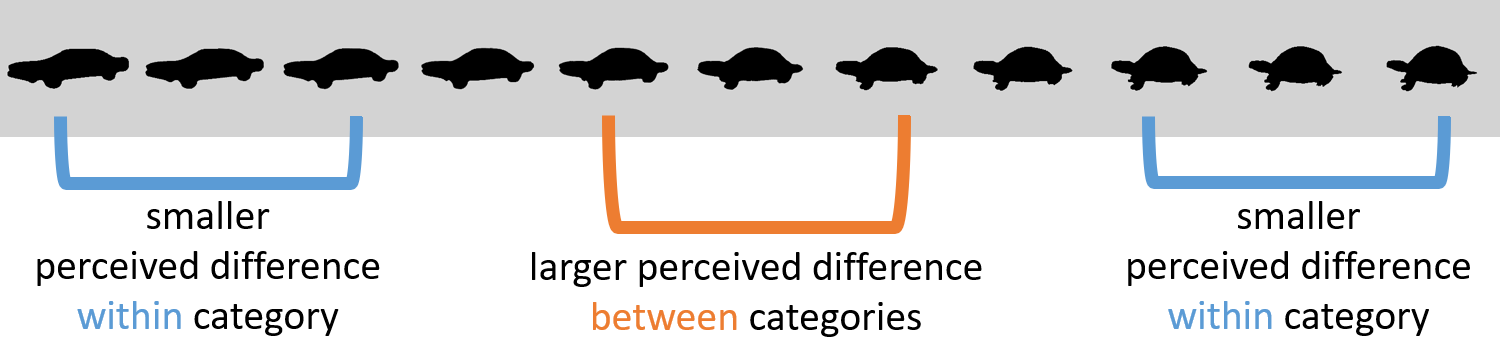
Which factors influence the formation and adaptation of psychological scales? Previous research suggests that the categories an individual employs influence one’s perception, a phenomenon referred to as categorical perception (CP; Goldstone & Hendrickson, 2010). One of the most prominent findings related to CP is the category boundary effect (see Figure 3.1)1: Keeping physical distance equal, differences between stimuli belonging to the same category are perceived as smaller than differences between stimuli belonging to different categories (i.e., stimulus pairs crossing the category boundary, Harnad, 1987). It is typically assessed by looking for better discrimination performance for physically equidistant pairs of stimuli in which each stimulus belongs to a different category compared to pairs in which both stimuli belong to the same category (Harnad, 1987; Newell & Bulthoff, 2002). This does not mean, however, that within-category differences cannot be noticed at all; the category boundary effect is about a decreased ability rather than a complete inability to discriminate within-category members (Harnad, 2003; see also Shepard, 1987).
3.1.2 The category boundary effect as a consequence of reference points
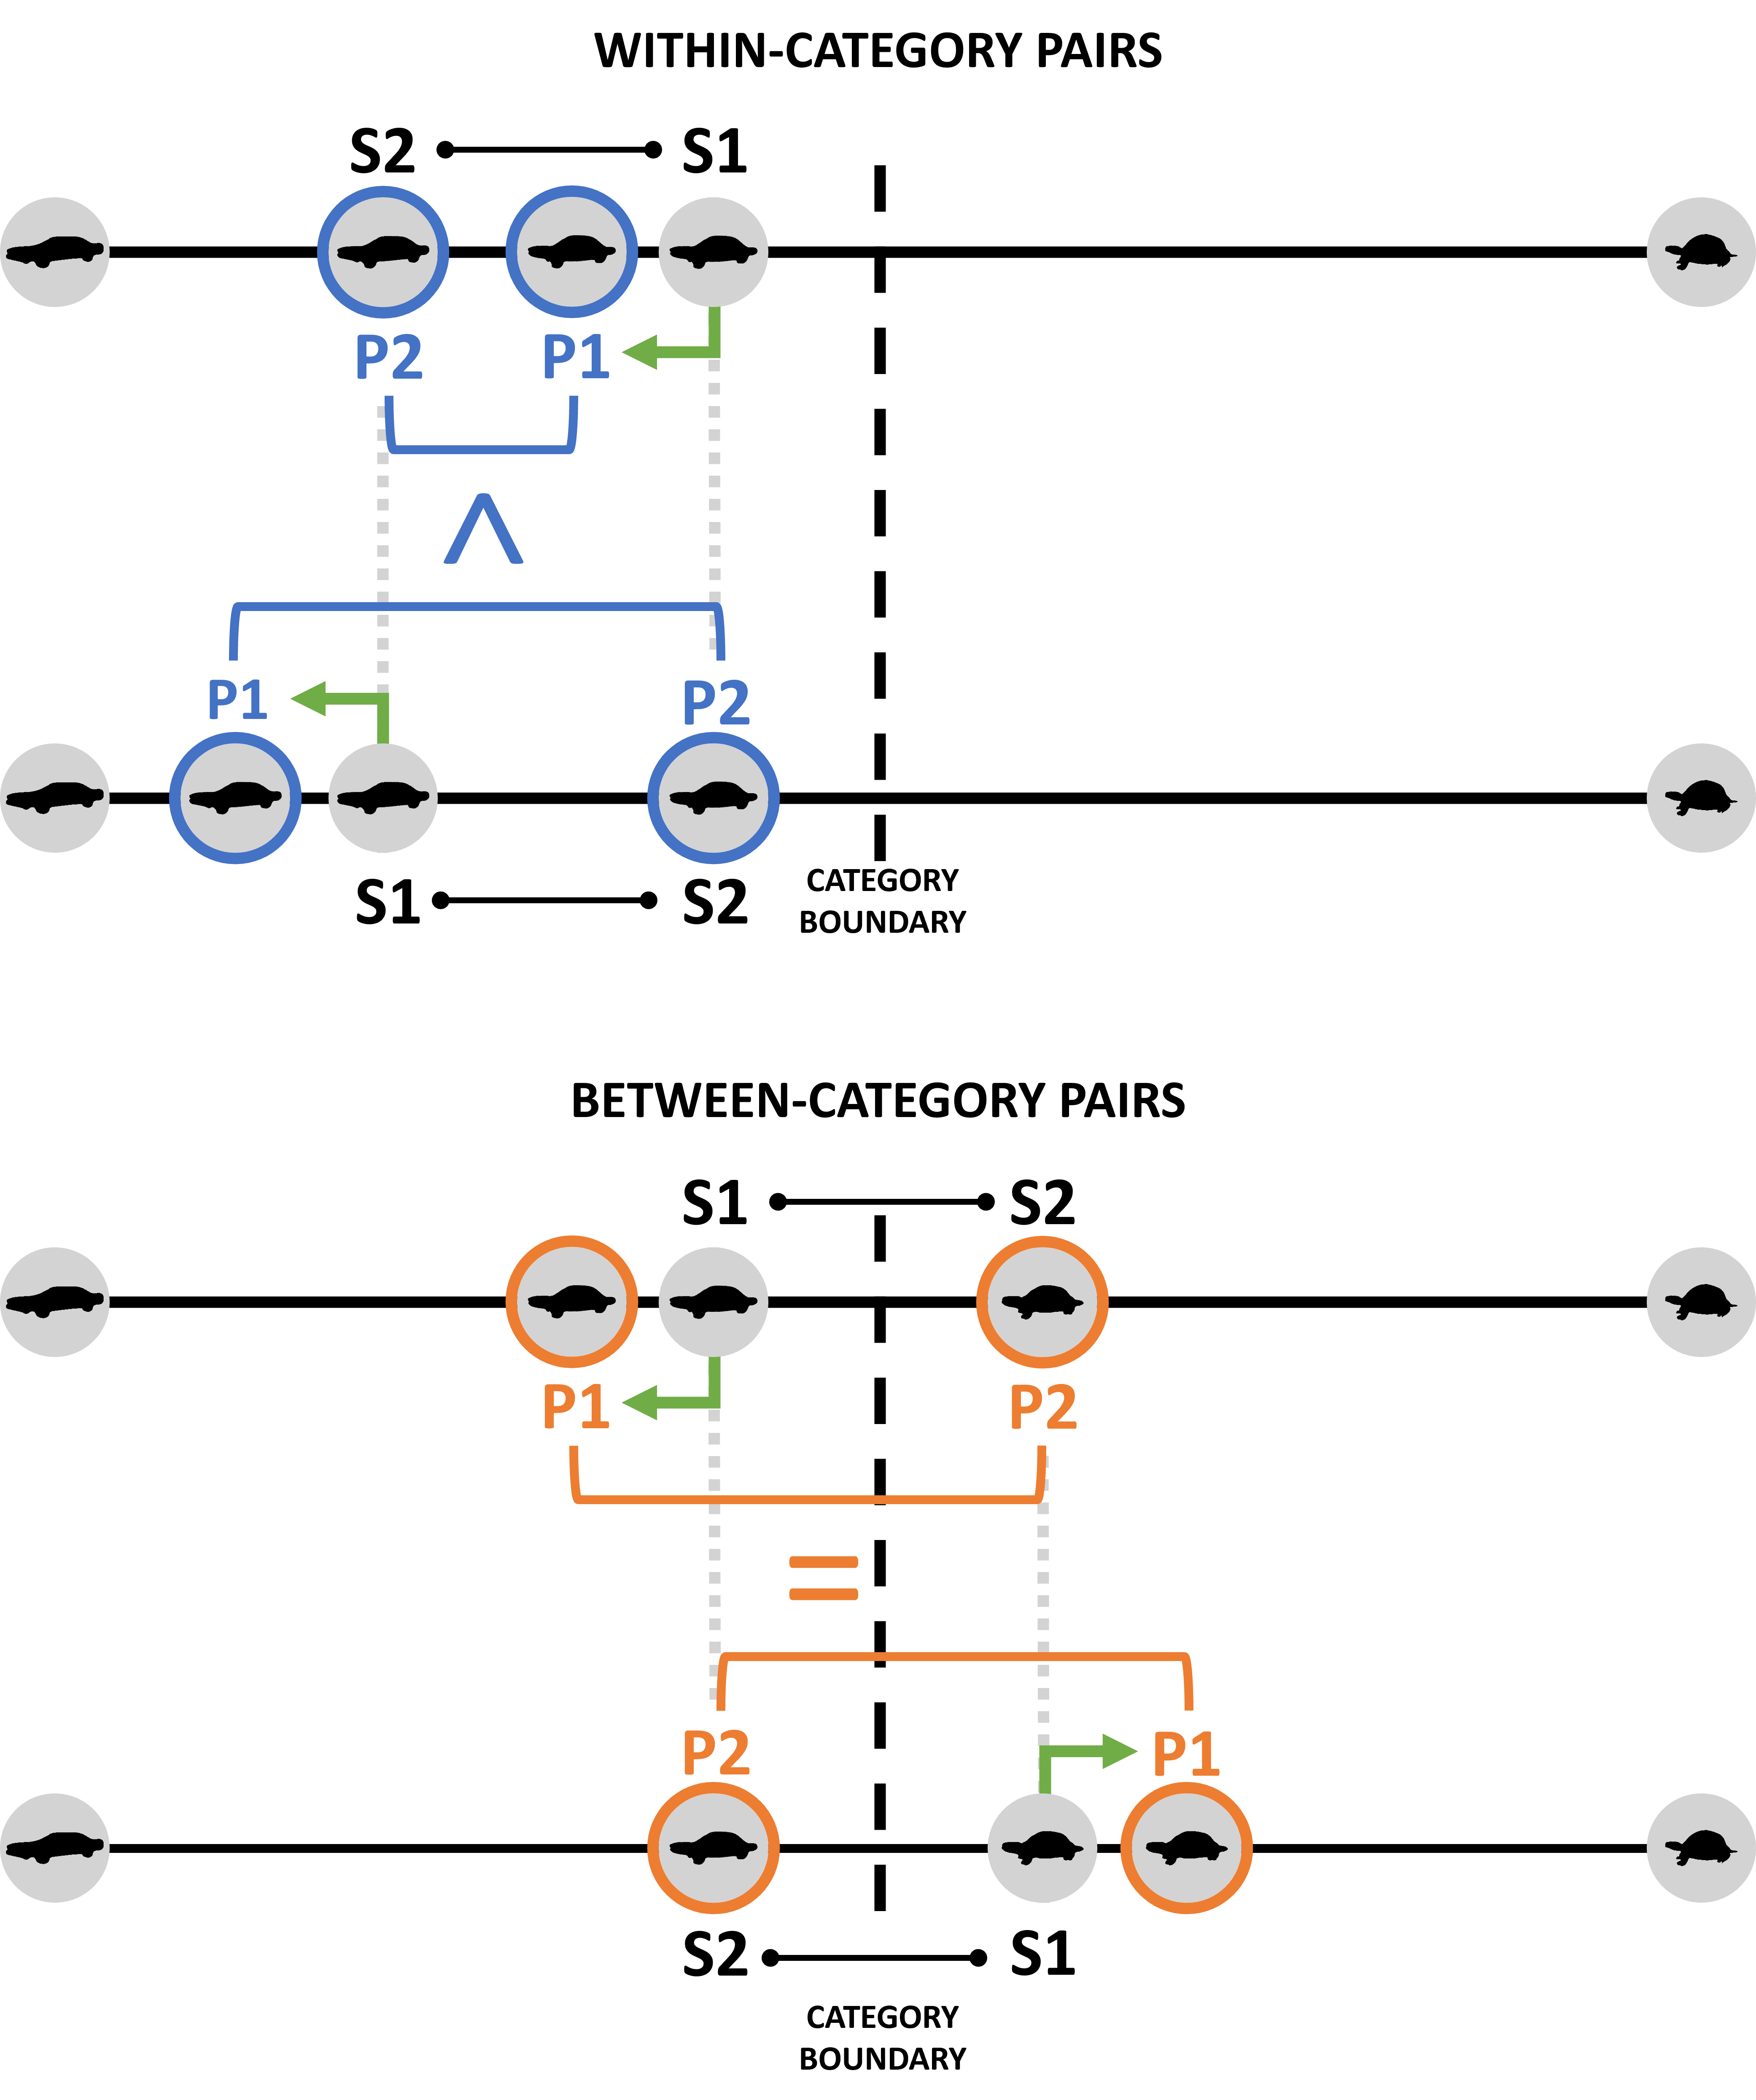
Why would discrimination performance be poorer for within-category than for cross-category pairs? Often the category boundary effect has been claimed to be the result of heightened natural discrimination sensitivity around the category boundary (Pastore, 1987; Repp & Liberman, 1987). When discrimination sensitivity was tested at threshold, however, no evidence was found for lower discrimination thresholds at the category boundary (Hanley & Roberson, 2011; Roberson et al., 2007, 2009). The category boundary effect can thus not be explained by heightened natural sensitivity at the boundary, as heightened sensitivity would have resulted in a lower threshold for discrimination at the category boundary compared to other segments of the continuum. Later research showed that within-category discriminability is not always poorer than between-category discriminability (Hanley & Roberson, 2011; Roberson et al., 2007): For within-category pairs, an asymmetry in discriminability was found (see Figure 3.2). Discriminability was tested here using an XAB task, in which a two-alternative forced-choice task was presented after a target was shown separately. Only when the target stimulus was closer to the category boundary (and thus more ambiguous) than the distractor, the within-category discriminability was poorer than the discriminability across the category boundary (Hanley & Roberson, 2011).2 Similar asymmetries have been found, for instance, in similarity judgment (e.g., Op de Beeck et al., 2003a; Panis et al., 2011) and visual search tasks (e.g., Kayaert et al., 2011). In similarity judgment tasks, participants judged two stimuli as more similar when the stimulus further away from the reference point was compared to the stimulus closer to the reference point rather than the other way around (e.g., 99 is more similar to 100 than 100 is to 99, with 100 being the reference point; Op de Beeck et al., 2003a; Panis et al., 2011; Polk et al., 2002; Rosch, 1975; Tversky, 1977). Likewise, performance in a successive discrimination task, assessed by both accuracy and reaction time, was worse when the stimulus further away from the reference point was compared to the stimulus closer to the reference point rather than the opposite. This effect has been given many names (e.g., time-order effect in Patching et al., 2012; directional asymmetries in Polk et al., 2002; asymmetric similarity in Nosofsky, 1991; contraction bias in Ashourian & Loewenstein, 2011). The existence of these asymmetries (i.e., making discrimination more difficult when a stimulus further away from the reference point was compared to a stimulus closer to the reference point) corroborates the idea that heightened natural sensitivity at the boundary is not what explains the category boundary effect.
More importantly, both the asymmetries found and the general category boundary effect may be consequences of the existence of reference points (see Figure 3.2). For the morph series and tasks used in the current study, we define the extremes on the dimension as the logical reference points (i.e., ‘clear’ exemplars that serve as a point of comparison, in relation to which other exemplars on the dimension are perceived). Rather than a consequence of inter-item similarity, the asymmetries found may arise because of the properties of individual items presented, also referred to as ‘stimulus bias’ (Nosofsky, 1991). When comparing stimuli within the same category, the first stimulus presented (S1) would then be drawn towards the reference point, making discrimination more difficult when compared to a second stimulus closer to the reference point (S2). However, when the first stimulus presented in the within-category pair is compared to a second stimulus further away from the reference point, discrimination would become easier rather than more difficult. For between-category pairs however, this tendency towards the reference points will always increase the psychological distance between the stimuli in the pair, leading to the overall observed category boundary effect (i.e., between-category pairs are overall easier to discriminate than physically equidistant within-category pairs). As more time has passed since the presentation of S1, S1 will be more susceptible to memory effects than S2, which was presented more recently and thus is retained more perceptually.
The assimilation to prototypes or perceptual magnet hypothesis states that reference points shrink the psychological distance around them, which implies decreased sensitivity around reference points (Feldman et al., 2009; Hellström, 2007; Kuhl, 1991; Samuel, 1982). The perceptual anchor hypothesis suggests that reference points (i.e., anchors) cause an increase in sensitivity in their vicinity (Acker et al., 1995; Quinn, 2000). Evidence has been found for both of these hypotheses, and task context seems to be a moderating factor (Quinn, 2000): Whereas increased sensitivity around reference points (above threshold) has been found for tasks involving direct perceptual comparisons with plenty of perceptual evidence present and minimal memory demands, decreased sensitivity around reference points has been reported for tasks in which a currently available stimulus was compared to stimuli stored in memory (i.e., for which there was limited perceptual input). Put differently, anchor effects may be more related to early perceptual processing, whereas magnet effects may arise from later perceptual or cognitive processing (Quinn, 2000).
3.1.2.1 Earlier work on the functions of reference points in the Gestalt psychological literature
This double function of reference points–on the one hand attracting and on the other hand repelling neighboring stimuli–has been suggested much earlier than the 90’s of last century. As discussed more extensively elsewhere (Van Geert & Wagemans, 2023), already since the emergence of the concept, “goodness” or Prägnanz was related to very low identity tolerance (i.e., very high sensitivity to change, related to the anchor effect) as well as to serving as a reference for a broad range of stimuli (i.e., high robustness against transformation, related to the magnet effect). Wertheimer (1923) indicated that shapes close to a prägnant step appear as [perceptually] different from but [categorically] related to the prägnant Gestalt: “as a somewhat ‘poorer’ version of it” (p. 318). In other words, although shapes close to the prägnant form can be perceptually discriminated from it, they are still categorized in relation to this prägnant form: the prägnant form serves as a reference point.
In situations in which there is limited perceptual evidence (e.g., in tachistoscopic presentation conditions and tasks involving memory), a tendency towards the prägnant form (i.e., reference point) was observed, with assimilation to the prägnant form (i.e., a tendency towards Prägnanz of the Gestalt, Köhler, 1920; Stadler et al., 1979; Wertheimer, 1923). Consequently, it is more difficult to transform prägnant figures into non-prägnant ones than the other way around (Goldmeier, 1937, 1982). This tendency towards prägnant forms is in line with the asymmetry effects found in the categorical perception literature: If conditions with limited perceptual evidence lead to a tendency to transform less prägnant figures (i.e., figures further away from the reference point) into more prägnant ones (i.e., figures closer to the reference point), this will make stimulus pairs in which the exemplar further away from the reference is compared to an exemplar closer to the reference point to be perceived as more similar than when the exemplar closer to the reference point is compared to an exemplar further away from the reference. Similarly, this tendency will make discrimination between stimulus pairs in which the less prägnant exemplar is compared to the more prägnant exemplar more difficult than when the more prägnant exemplar is compared to the less prägnant one (see Figure 3.2).
Furthermore, Wertheimer (1923) mentioned that in-between distinctive regions, there are often intermediate series that are “not unequivocal to the same degree, not quite as salient [prägnant], “less definite” in their character, less pronounced, and often more easily seen in terms of one grouping3 or the other” (Wertheimer, 1923, p. 317; translated by Spillmann, Wertheimer et al., 2012). This description of less prägnant Gestalts indicates that prägnant forms (i.e., reference points) are often related to ease of categorization, as it is easier for less prägnant Gestalts to change their category membership. Empirical work has confirmed that distance from reference points (either at the category center or the extremes) can predict ease of classification (Medin, 1989; Medin & Barsalou, 1987). Relatedly, proximity of a stimulus to the category boundary has been found to increase the difficulty of categorization (Gillebert et al., 2009; Grinband et al., 2006).
Also Goldmeier’s (1937, 1982) characterization of Prägnanz as singularity stressed this double functionality of reference points. First and foremost, he described singularity as sensitivity to change: whereas coding accuracy is high in the narrow range of prägnant Gestalts, nonsingular values are coded only approximately. He thus predicted a greater discriminative ability for figures in a small range around the reference points. Secondly, he discussed singularity as a norm or reference: in the near-prägnant zone, feature values of a stimulus are perceived in relation to the reference points on that feature dimension.
Goldmeier’s hypothesis relates very closely to the observed category boundary effect and its limits: We can interpret prägnant steps as several categories lying on a dimension, with intermediate steps that are categorized in function of these prägnant steps, but intermediate steps can be perceptually distinguished from prägnant steps when enough perceptual evidence is available. The jumps (i.e., the transitions between a prägnant and an intermediate step) in the dimension relate to the increased discrimination performance around the category boundary, and more importantly to jumps in psychological scaling: “In general, if one varies a component […], in systematic steps, then the resulting impressions are psychologically not a mass of individually characteristic impressions consisting of evenly balanced matched steps. Rather, particular salient steps [Prägnanzstufen] occur, each with its range; the progression shows breaks. Intermediate steps typically appear as related to one of the salient forms [Prägnanzformen].” (Wertheimer, 1923, p. 319; translated by Spillmann, Wertheimer et al., 2012).
3.1.2.2 Later work on ‘goodness’ and reference points influencing perceived similarity and discrimination performance
3.1.2.2.1 ‘Goodness’ influencing encoding and memory generation, similarity influencing comparison
Garner and colleagues built on the earlier Gestalt psychological literature and found support for the effects of pattern ‘goodness’ on perceptual discrimination (Clement & Varnadoe, 1967; Garner, 1974; Pomerantz, 1977; Pomerantz & Garner, 1973), recognition memory, paired-associates learning, and verbal encoding of stimulus patterns (Garner, 1974). They proposed that discrimination difficulty (operationalized as total discrimination time) depended on three different components or subprocesses: (a) the ease of stimulus encoding of the individual stimuli; (b) the ease of memory generation for the stimulus presented first; and (c) the ease of stimulus comparison of the two alternatives (Garner, 1974). They further argued that the required encoding time and time for memory generation depended on pattern goodness, whereas comparison time depended on stimulus similarity.
Also some more recent observations provide evidence in the direction of a link between goodness and ease of encoding (Irwin & Pachella, 1985). Caddigan et al. (2017) found that the degree to which an image exemplifies its category influences how easily it is detected. Rauschenberger & Yantis (2006) indicate that in visual search tasks, perceptual ‘goodness’ (i.e., Prägnanz) of the non-target stimuli determines the efficiency of visual search.
3.1.2.2.2 Reference points provide categories with an internal structure
Also Rosch’s (1975) work on cognitive reference points built on the Gestalt psychological literature described above. As she indicates, categories are often not clearly delineated, but rather build around prototypes (i.e., clearest cases, best examples), with non-prototype category members tending to the prototype to a certain extent, which may lead to systematic asymmetries in perceived similarity (Tversky, 1977).
3.1.2.2.3 Asymmetric similarity can be explained by differential stimulus bias
Nosofsky (1991), following up on the work by Garner and colleagues (1974), proposed that asymmetric similarity results can alternatively be interpreted as symmetric similarity results together with differential stimulus bias. Whereas similarity relates to a relation between two stimuli, bias relates to individual stimuli. More concretely, if the bias associated with item a is larger than the bias associated with item b, item b will tend to be confused more with item a than item a will be confused with item b (Nosofsky, 1991). Some stimuli are particularly salient in perception and memory, and are more easily encoded than other stimuli. These characteristics relate to individual stimuli rather than pairs of stimuli, and can therefore better be described as stimulus biases than as asymmetric similarities. In other words, there may be prior biases to perceive or remember certain stimuli, independent of the stimulus that is actually presented, and these stimulus biases may consequently influence perceived similarity (Nosofsky, 1991).
3.1.3 The current study
In this study, we investigated how reference points influence categorization and discrimination performance, using three different tasks: (a) a categorization task, (b) a discrimination task, and (c) a similarity judgment task. For the morph series and tasks used, we define the extremes on the dimension as the logical reference points (i.e., ‘clear’ exemplars that serve as a point of comparison, in relation to which other exemplars on the dimension are perceived). In the categorization task, we assessed whether distance from the reference points influenced ease of classification in both categorization responses and reaction time. In the discrimination and similarity judgment tasks, we investigated whether we could replicate the category boundary effect as well as the expected asymmetries in within-category pairs. To be able to approximately equalize the physical distance of stimuli along a continuum between two category reference points, we used morph images as stimuli (i.e., stimuli created by morphing between exemplars of two different categories, see for example Figure 3.1). As we assumed both the category boundary effect and the directional asymmetries in within-category pairs to be consequences of a tendency towards reference points, the strength of these effects would depend on the strength of the reference points in question. Therefore, we used both recognizable and non-recognizable morph figures as stimuli, as we assumed the recognizable morph series to have better (‘clearer’) reference points: Whereas recognizable morph series have clear known reference points, morphs between two artificial stimuli can only be learned gradually by building experience with the stimuli. A categorization task was included to evaluate the categorization strength for each of the different stimuli presented. As will become clear from the results, we show that the category boundary effect has little to do with the relation between stimuli in a pair, but is rather a consequence of stimulus bias, as already indicated by Garner (1974) and Nosofsky (1991), for instance. The general ‘category boundary effect’ only emerged because of averaging across all physically equidistant stimulus pairs without taking each stimulus’ distance from the reference points into account. We provide evidence that, in this study, discrimination performance and perceived similarity were - besides the influence of physical (dis)similarities - largely a consequence of categorization strength (related to a tendency towards the reference points) of the individual stimuli in the pair.
3.2 Methods
3.2.1 Transparency and openness
We report how we determined our sample size, all data exclusions (if any), all manipulations, and all measures in the study. The study design and analyses were not pre-registered. This manuscript was written in RMarkdown using the papaja package (Aust & Barth, 2022) with R code for data analysis integrated into the text. The data, materials, and analysis and manuscript code for the experiment are available on the Open Science Framework (https://doi.org/10.17605/osf.io/ugcd8).
3.2.2 Participants
283 first-year psychology students from KU Leuven participated in the study. The number of participants was dependent on the number of students subscribing and actually showing up to take part in the study in the prespecified time slots for the study planned between November 12 - 16, 2018. Participants were granted one research credit for participation. Of those 283 participants, 250 (88.34%) were female. Age of the participants varied between 17 and 23 years (Mage = 18.22 years, SDage = 0.86 years). Age information concerning one participant is missing because of technical issues during data collection. For 272 of the 283 participants (96.11%), Dutch was their mother tongue. The study received ethical approval from the Social and Societal Ethics Committee of the authors’ institution (G-2018 06 1266).
3.2.3 Stimuli
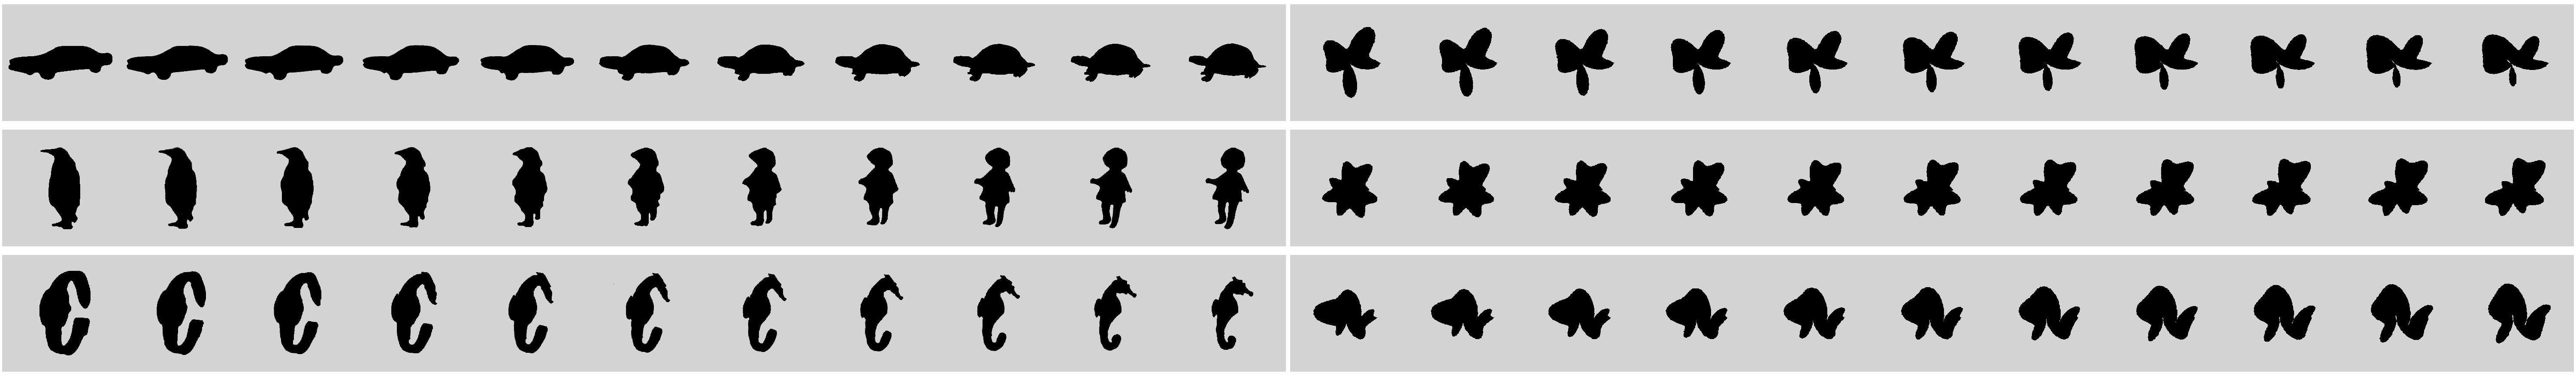
Stimuli (see Figure 3.3) were recognizable and non-recognizable morph series containing 11 stimuli each. The recognizable morph series were based on the ones used in Hartendorp et al. (2010) and Burnett & Jellema (2013). The non-recognizable morph series were based on stimuli from Op de Beeck et al. (2003b). We define the “morph level” of the eleven stimuli per series from -5 to 5, with morph level -5 indicating the most left stimulus in the morph series and morph level 5 indicating the most right stimulus in the morph series as presented in Figure 3.3. For the purpose of the study, all recognizable stimuli were converted to greyscale and changed to have a square format. All recognizable and non-recognizable stimuli were made black (0) on a grey (211) background. Images for each morph series were resized based on the mean number of non-grey pixels in that series. Then, images were cropped and squared to the same size for all images. Finally, physical similarity between neighboring stimuli was calculated. For the non-recognizable morph series, the final physical difference between neighboring stimuli in the morph series used was bigger than in the study by Op de Beeck et al. (2003b). This was done to approximately match the physical similarity between neighboring stimuli in the non-recognizable morph series with the physical similarity between neighboring stimuli in the recognizable morph series. Also, the starting amplitude for the non-recognizable stimuli was sometimes changed compared to the one used in Op de Beeck et al. (2003b) to avoid “holes” in the stimuli at the end of the series. The non-recognizable stimuli were generated in Matlab R2018a. Both the recognizable and non-recognizable stimuli were adapted (as described above) using Python 2.7.
3.2.4 Procedure
The experiment was written in Python 2.7 and run on Windows computers with TFT screens of 21.5”. Screen luminance and contrast were both set to 65%. Students participated in a room with up to 23 other participants present. After giving informed consent, participants were asked for their participant number, gender, age, and mother tongue. Each participant then completed each main task of the study (categorization, discrimination, and similarity judgment task) twice: once for a recognizable and once for a non-recognizable morph series. Every participant completed one task per morph series: all three tasks were completed for a different recognizable and non-recognizable morph series. The assignment of morph series to tasks was counterbalanced between participants.4 The order of the three tasks and the order of recognizable versus non-recognizable series was randomized across participants. Before the start of each new task, participants got instruction screens explaining what was expected from them during that task, and they got four example trials with a different morph series (see Figure 3.4). In all tasks, the exact position of the stimuli on the screen was jittered (from -20 to 20 on both x and y axes) to prevent focus on local feature changes only.

At the start of the categorization task, participants were shown the four most ‘clear’ exemplars per category (i.e., the four most left and four most right examples for each morph series of eleven exemplars as shown in Figure 3.3), to give them an idea of the categories. Within each category, the presentation order of the four exemplars was randomized. Each trial in the categorization task consisted of (a) the presentation of a fixation cross (400 ms); (b) the presentation of the stimulus (300 ms); (c) a response screen reminding participants to press the left arrow key for category A and the right arrow key for category B. Which end of the series was labeled as category A was randomized across participants. Each stimulus in the morph series was presented 5 times (55 trials in total), and presentation order was randomized.
Each trial in the discrimination task consisted of (a) the presentation of a fixation cross (400 ms); (b) the presentation of a first stimulus (300 ms); (c) intertrial interval (500 ms); (d) the presentation of a second stimulus (300 ms); and (e) a response screen reminding participants to press the left arrow key for same (different) and the right arrow key for different (same). Which key press was related to same or different was randomized across participants. All possible different trials were presented once in each direction, all possible same trials were presented 5 times (165 trials in total), and presentation order was randomized.
Each trial in the similarity judgment task consisted of (a) the presentation of a fixation cross (400 ms); (b) the presentation of a first stimulus (300 ms); (c) intertrial interval (500 ms); (d) the presentation of a second stimulus (300 ms); and (e) a response screen including a 9-point rating scale on which participants indicated how strongly the two figures resembled each other, going from 1 (very different) to 9 (very similar). All possible different trials were presented once in each direction, all possible same trials were presented twice (132 trials in total), and presentation order was randomized.
At the end of the study, participants were asked to indicate whether they wanted to get a debriefing email and/or an email concerning the results of the study.
3.2.5 Data analysis
We used R [Version 4.0.4; R Core Team (2021)] for all our analyses.5 Preprocessing included (a) combining datafiles per participant into datafiles for all participants combined; (b) pseudonymizing the data; (c) recoding key press responses in the categorization task when the series was reversed; (d) recoding key press responses in the discrimination task when the same and different buttons were reversed; and (e) adding additional variables to the categorization, discrimination, and similarity judgment data for simplifying further analyses. We excluded categorization data from participants for a particular morph series when their probability to label the stimulus as category B was higher or equal for level 0 compared to level 10, assuming that they used the response labels opposite to how it was instructed. When analyzing categorization response times, we excluded response times below 200 ms and above 3 seconds.
We excluded discrimination data concerning a specific participant and morph series when the mean accuracy for the given participant and morph series was more than two standard deviations below the overall mean accuracy for that morph series. When analyzing discrimination response times, we excluded response times below 200 ms and above 3 seconds.
Similarity ratings were standardized per participant per morph series to decrease the impact of differential scale use across participants.
To investigate our research questions, we fit hierarchical regression models using the brms (Bürkner, 2017) package in R (see below as well as Appendix A for more information). In all these models, we chose to estimate the effects for each of the morph series separately rather than to directly distinguish the groups of recognizable and non-recognizable morph series. This separation allows a more complete investigation of the effects per morph series, and similar results across several morph series of the same type (recognizable vs. non-recognizable) can be treated as replications. With only three morph series per type, it is difficult to generalize the results to the type of series as such (recognizable vs. non-recognizable), and therefore we prefer this small multiples approach.
3.2.5.1 Categorization responses
In the categorization data, we were interested in whether there was a clear categorization present for all morph series, and whether the categorization strength was stronger for recognizable than for non-recognizable morph series. We fitted a hierarchical Bayesian binomial logistic regression model to the categorization response data with morph level as fixed effect, for each morph series separately, and participant ID within each morph series as random effect for both intercept and slope. To investigate whether categorization strength was stronger for the recognizable than for the non-recognizable morph series, we plot the posterior distributions for the effect of morph level from the model and compare the slope strengths across morph series by plotting contrast distributions for the slopes.
Additionally, we expected categorization response times for exemplars closer to the reference points to be faster than those for more ambiguous exemplars. We therefore fitted a hierarchical Bayesian lognormal regression model to the categorization response time data with morph level and morph level squared as fixed effects, for each morph series separately, and participant ID within each morph series as random effect for both intercept and slopes. To investigate whether the difference in categorization time depending on morph level was larger for the recognizable than for the non-recognizable morph series, we plot the posterior distributions for the quadratic term from the model and compare the slope strengths across morph series by plotting the contrast distributions.
3.2.5.2 Discrimination responses
To investigate the presence of differences in discrimination sensitivity across stimulus pairs, we fitted a hierarchical Bayesian binomial logistic regression model to the discrimination response data with stepsize as fixed effect, for each morph series separately, and with trial stimuli and participant ID within each morph series as random effects for intercept and participant ID within each morph series as random effect for the slope. We plot the posterior predictions from the model for stepsizes 1 to 5 and separately for within- and between-category pairs. To investigate the presence of category boundary effects, we plot the difference in the expectation of the posterior predictive distributions for between-category compared to within-category pairs, per stepsize and morph series. The category boundary was determined as the middle between the two morph levels where the point of subjective equality was crossed, based on the categorization data collected in the study. To investigate whether the effect of stepsize on discrimination sensitivity was stronger for the recognizable than for the non-recognizable morph series, we plot the posterior distributions for the effect of stepsize from the model and compare the slope strengths across morph series by plotting contrast distributions for the slopes. To further investigate other trends in the data, we also plot the posterior predictions from the model for each stimulus pair separately.
To further investigate the presence of an overall category boundary effect (i.e., difference in discrimination sensitivity for equidistant between-category versus within-category pairs), we fitted a hierarchical Bayesian binomial logistic regression model to the discrimination response data for stepsizes 1 to 5 (i.e., the stepsizes which had both within- and between-category pairs) with stepsize as fixed effect, for each morph series and trial type separately, and with trial stimuli and participant ID within each morph series as random effects for intercept and participant ID within each morph series as random effect for the slope. To investigate whether the category boundary effect on discrimination sensitivity was stronger for the recognizable than for the non-recognizable morph series, we plot the posterior distributions for the main effect of trial type as well as for the interaction between stepsize and trial type from the model and compare the slope strengths across morph series by plotting contrast distributions for the slopes.
To investigate the presence of directional asymmetries, we fitted a hierarchical Bayesian binomial logistic regression model to the discrimination response data with stepsize as fixed effect, for each morph series separately, and with ordered trial stimuli and participant ID within each morph series as random effects for intercept and participant ID within each morph series as random effect for the slope. We then plot the posterior predictions from the model for each ordered stimulus pair separately.
3.2.5.3 Similarity judgments
In the similarity judgment data, we also wanted to investigate potential differences in perceived similarity across stimulus pairs, whether an overall category boundary effect was present, and whether directional asymmetries emerged. To investigate the presence of differences in perceived similarity across stimulus pairs, we fitted a hierarchical Bayesian linear regression model to the by-participant-standardized similarity judgments with stepsize as fixed effect, for each morph series separately, and with trial stimuli and participant ID within each morph series as random effects for intercept and participant ID within each morph series as random effect for the slope. We plot the posterior predictions from the model for stepsizes 1 to 5 and separately for within- and between-category pairs. To investigate the presence of category boundary effects, we plot the difference in the expectation of the posterior predictive distributions for between-category compared to within-category pairs, per stepsize and morph series. To investigate whether the effect of stepsize on perceived similarity was stronger for the recognizable than for the non-recognizable morph series, we plot the posterior distributions for the effect of stepsize from the model and compare the slope strengths across morph series by plotting contrast distributions for the slopes. To further investigate other trends in the data, we also plot the posterior predictions from the model for each stimulus pair separately.
To further investigate the presence of an overall category boundary effect (i.e., difference in perceived similarity for equidistant between-category versus within-category pairs), we fitted a hierarchical Bayesian linear regression model to the by-participant-standardized similarity judgments for stepsizes 1 to 5 (i.e., the stepsizes which had both within- and between-category pairs) with stepsize as fixed effect, for each morph series and trial type separately, and with trial stimuli and participant ID within each morph series as random effects for intercept and participant ID within each morph series as random effect for the slope. To investigate whether the category boundary effect on perceived similarity was stronger for the recognizable than for the non-recognizable morph series, we plot the posterior distributions for the main effect of trial type as well as for the interaction between stepsize and trial type from the model and compare the slope strengths across morph series by plotting contrast distributions for the slopes.
To investigate the presence of directional asymmetries, we fitted a hierarchical Bayesian linear model to the by-participant-standardized similarity judgments with stepsize as fixed effect, for each morph series separately, and with ordered trial stimuli and participant ID within each morph series as random effects for intercept and participant ID within each morph series as random effect for the slope. We then plot the posterior predictions from the model for each ordered stimulus pair separately.
3.3 Results
3.3.1 Categorization task
3.3.1.1 Categorization responses
As can be seen in Figures 3.5 and 3.6, the recognizable morph series show a considerably larger effect of the morph level presented, and thus show stronger categorization. Estimated pairwise differences between the posterior distributions for the effect of morph level on categorization as category B show strong evidence for a larger effect of morph level in the recognizable morph series compared to the non-recognizable morph series (see Figure 3.6). The posterior probability for the recognizable morph series to have a more positive slope across morph level than the non-recognizable morph series was 100%, regardless of the specific morph series compared. In other words, categorization (and the tendency towards reference points) was stronger for morph series with clear, pre-existing reference points (i.e., the recognizable ones) compared to morph series without clear reference points (i.e., the non-recognizable ones). Based on the estimated posterior distributions for categorization responses, categorization strength was highest for the recognizable morph series car-tortoise and penguin-child and lowest for the non-recognizable morph series set 2 (see Figure 3.6).
3.3.1.2 Categorization response times
As visible from Figures 3.7 and 3.8, the recognizable morph series show a considerably larger effect of the morph level presented on the categorization response times than the non-recognizable morph series: In the recognizable series, response times are faster for exemplars closer to the reference points than for more ambiguous exemplars. This fits with earlier findings relating ‘goodness’ to ease of encoding and categorization. Estimated pairwise differences between the posterior distributions for the quadratic effect of morph level on categorization response times show strong evidence for a larger quadratic effect of morph level (i.e., more negative, indicating smaller response times for the morph levels closer to the reference points than for the middle morph levels) in the recognizable morph series compared to the non-recognizable morph series (see Figure 3.8). The posterior probability for the non-recognizable morph series to have a quadratic effect across morph level closer to zero than the recognizable morph series was 100%, regardless of the specific morph series compared. In other words, also in the response times, categorization (and the tendency towards reference points) was stronger for morph series with clear, pre-existing reference points than for morph series without clear reference points. Based on the estimated posterior distributions for categorization response time, categorization strength was highest for the recognizable morph series penguin-child and car-tortoise and lowest for the non-recognizable morph series set 2 and set 1 (see Figure 3.8).
3.3.1.3 Definition of category boundary
The category boundary was defined as the middle between the two morph levels where the 50%-boundary (i.e., point of subjective equivalence) was crossed. Although this is an arbitrary decision, we only depend on it when plotting the typical category boundary effect in the successive discrimination and similarity judgment tasks (i.e., adding all physically equidistant within-category pairs and between-category pairs together), not when plotting the results per stimulus pair. The category boundaries used are indicated in Figures 3.5 and 3.7.
3.3.2 Successive discrimination task
3.3.2.1 Discrimination responses
Figure 3.9 shows the empirical proportions and posterior predictive distributions for responding ‘different’ in the successive discrimination task, per stepsize, trial type (i.e., between-category vs. within-category), and morph series, averaged across participants. The posterior predictive results shown are based on a model fit using the discrimination data of all stepsizes (0-11), with stepsize as a predictor, a separate intercept and slope per morph series, and random effects of stimulus pair and participant within each morph series (see Methods section and Appendix A). Stepsize indicates the absolute difference in morph level between the two morph stimuli presented in a trial, with a minimum of zero (for same trials) and a maximum of eleven (when both extremes or reference points of the morph series are presented). Only stepsizes 1 to 5 are shown, as higher stepsizes only included between-category pairs and no within-category pairs, and stepsize 0 only included same trials (for a visualization including all stepsizes, see Supplementary Figure A.1).
Despite approximately matching the physical similarity between neighboring stimuli in the non-recognizable morph series with the physical similarity between neighboring stimuli in the recognizable morph series, the effect of stepsize on the probability of ‘different’ responses was lower for the non-recognizable compared to the recognizable morph series, regardless of the specific recognizable and non-recognizable morph series that were compared (see Figures A.2B and A.3). In other words, discrimination sensitivity for a fixed stepsize was higher for the recognizable compared to the non-recognizable morph series.
In Figures 3.9 and 3.10, the typically reported category boundary effect (i.e., the difference between the darker and lighter bars per stepsize) seems larger in the recognizable morph series compared to the non-recognizable morph series. To estimate the size of the category boundary effect for each morph series, we fitted a separate model only including trials with stepsizes 1 to 5 and with trial type (i.e., within-category vs. between-category) and the interaction between trial type and stepsize as additional predictors (for model details, see the Methods section and Appendix A). In this separate model, all morph series except for set 2 on average showed a category boundary effect (see Figure A.4C and recognizable morph series car-tortoise and penguin-child showed a stronger main category boundary effect (i.e., effect of trial type) than all non-recognizable morph series (see Figure A.4C and Figure 3.11C). Recognizable series penguin-child showed a more negative interaction effect between stepsize and trial type than the non-recognizable series: for the series penguin-child the category boundary effect decreased more strongly with increasing stepsize than for the other morph series (see Figure 3.11D and Figure A.4D).
The results for the discrimination task fit with the categorization results: the stronger the categorization for a morph series, the stronger the difference in discrimination performance between within- and between-category pairs (i.e., the main effect of trial type), or in other words, the stronger the category boundary effect.6 This is the case even though for each morph series, the categorization and discrimination data were collected from different subgroups of participants, and none of the participants in the discrimination task had any prior experience with or information about the morph series in question.
What is remarkable, however, is what happens when plotting the data of the original model including all discrimination data for each stimulus pair within each stepsize separately (see Figure 3.12). A clear peaked pattern emerges: for physically equidistant stimulus pairs, the closer the stimuli in the pair are to one of the reference points, the worse discrimination performance becomes. Rather than a general effect of being a within- or between-category comparison, the effect is much more gradual and related to characteristics of the individual stimuli involved in the comparison. In other words, it is important to not treat the category boundary effect as a binary difference of within-category versus between-category pairs, but rather as a gradual effect of distance from the reference points for the individual stimuli in the pair. This is necessary as discrimination performance is heavily influenced by the clarity of the individual stimuli in the pair, as can be seen in Figure 3.12. For non-recognizable morph series, this peaked pattern is much less pronounced.
To further demonstrate the importance of the individual ‘goodness’ of the stimuli in the pair for discrimination performance, we plotted predictions of discrimination performance based solely on the predicted categorization probabilities of individual stimuli in a pair to be categorized as A or B (see Figure 3.13). For the recognizable morph series, these predictions show the same gradual, peaked pattern as can be viewed from the actual discrimination data, at least in a qualitative sense, indicating that the observed pattern is likely to be a consequence of properties (i.e., ‘goodness’) of the individual stimuli involved in the comparison rather than a consequence of stimulus similarity.
When modelling and plotting the probability of responding ‘different’ in the successive discrimination task for all stimulus pairs in both presentation orders separately, no clear directional asymmetries were present (see Figure A.5).
3.3.3 Similarity judgment task
3.3.3.1 Similarity judgment responses
Figure 3.14 shows the standardized empirical similarity scores and the posterior predictive distributions for the responses to the successive similarity judgment task per stepsize, trial type (i.e., between-category vs. within-category), and morph series, averaged across participants. The posterior predictive results shown are based on a model fit using the similarity judgment data of all stepsizes (0-11), with stepsize as a predictor, a separate intercept and slope per morph series, and random effects of stimulus pair and participant within each morph series (see Methods section and Appendix A). Only stepsizes 1 to 5 are shown, as higher stepsizes only included between-category pairs and no within-category pairs, and stepsize 0 only included same trials (for a visualization including all stepsizes, see Supplementary Figure A.6).
Similar to the results for the successive discrimination task, the effect of stepsize on the perceived similarity between the stimuli in a pair was smaller for the non-recognizable than for the recognizable morph series, despite approximately matching the physical similarity between neighboring stimuli across morph series (see Figures A.8 and A.7B). In other words, perceived similarity for a fixed stepsize was lower for the recognizable compared to the non-recognizable morph series.
In Figures 3.14 and 3.15, the category boundary effect in the similarity judgment task (i.e., the difference between the darker and lighter intervals per stepsize) seems larger for the recognizable morph series compared to the non-recognizable morph series. To estimate the size of the category boundary effect for each morph series, we fitted a separate model only including trials with stepsizes 1 to 5 and with trial type (i.e., within-category vs. between-category) and the interaction between trial type and stepsize as additional predictors (for model details, see the Methods section and Appendix A). In this separate model, all morph series on average showed a category boundary effect (albeit slightly; see Figure A.9C) and recognizable morph series car-tortoise and penguin-child showed a stronger main category boundary effect (i.e., effect of trial type) than all non-recognizable morph series (see Figures A.9C and 3.16C). Recognizable series watch-seahorse showed a more negative interaction effect between stepsize and trial type than the non-recognizable series: for watch-seahorse, the category boundary effect increased more strongly with increasing stepsize than for the non-recognizable series (see Figures 3.16D and A.9D).
As for the discrimination task, we can relate these results for the similarity judgment task to the results for the categorization task: the stronger the categorization for a morph series, the stronger the difference in perceived (dis)similarity between within- and between-category pairs (i.e., the main effect of trial type), or its interaction with stepsize. In other words, the stronger the categorization for a morph series, the stronger the category boundary effect in the similarity judgment task.7 As mentioned before, this is the case even though for each morph series, the categorization and similarity judgment data were collected from different subgroups of participants, and none of the participants in the similarity judgment task had any prior experience with or information about the morph series in question.
More importantly, when plotting the data for each stimulus pair within each stepsize separately (see Figure 3.17), the same clear gradual, inversely peaked pattern emerges as in the discrimination data for the recognizable morph series: for physically equidistant stimulus pairs in the recognizable morph series, the closer the stimuli in the pair are to one of the reference points, the more similar participants perceive the stimuli to be. Rather than a general effect of being a within- or between-category comparison, the effect is gradual in nature and relates to the characteristics of the individual stimuli involved in the comparison. In other words, also in a similarity judgment task, it is important not to treat the category boundary effect as a binary difference of within-category versus between-category pairs, but rather as a gradual effect of distance from the reference points for the individual stimuli in the pair. This is necessary as perceived similarity is heavily influenced by the clarity of the individual stimuli in the pair, as can be seen in Figure 3.17. For non-recognizable morph series, this peaked pattern is much less pronounced.
To further demonstrate the importance of the individual ‘goodness’ of the stimuli in the pair for perceived similarity judgments, we plotted predictions of perceived similarity based solely on the predicted categorization probabilities of individual stimuli in a pair to be categorized as A or B (see Figure 3.18). Although the predicted values do not match the absolute empirical values, these predictions show the same inversely peaked pattern as can be viewed from the actual similarity data. This indicates, just like in the results for the successive discrimination task, that the observed pattern is likely to be a consequence of properties (i.e., ‘goodness’) of the individual stimuli involved in the comparison rather than a consequence of stimulus similarity.
When modelling and plotting the standardized similarity scores for all stimulus pairs in both presentation orders separately, no clear directional asymmetries were present (see Figure A.10).
3.4 Discussion
In this study, we replicated the typically reported ‘category boundary’ effect in both a successive discrimination task and a similarity judgment task. Our analyses differed from those in many previous studies of the category boundary effect, as we did not average all equidistant pairs together in groups of within-category vs. between-category pairs. This alternative analysis enabled us to show a gradual rather than a binary pattern in the discrimination and similarity judgment data. No sudden jumps in discrimination performance occurred when either crossing the category boundary or not, but a gradual change in discrimination performance became visible. This gradual change depended on the distance of the individual stimuli compared to the reference points on the dimension. In other words, the ‘category boundary’ effect is not an effect of the category boundary8. We show that the category boundary effect is not a result of increased discrimination sensitivity across the category boundary, but rather related to the clarity of the individual stimuli involved in the comparison. Keeping physical distance between the stimuli in the pair equal, the closer the individual stimuli in the pair are to the reference points, the more perceptually similar the stimuli become and the more difficult discrimination becomes. This explanation is evidenced further by showing that the peaked qualitative pattern of observed discrimination responses can be predicted by solely using the categorization probabilities for the individual stimuli in the pair, even when collected from different participants.9 Just as Nosofsky (1991) indicated earlier for asymmetric similarities, also the category boundary effect needs to be explained by looking at properties of the individual stimuli involved in the comparison rather than by looking at the relation between the stimuli in the pair. The fact that we find a similar peaked pattern for both tasks, strengthens our interpretation of the findings.
We see the same influence of categorization strength not only within each stimulus dimension, but also across morph series. As predicted, both categorization and the category boundary effect were more clearly visible for some of the recognizable morph series than for some of the non-recognizable morph series. In addition, also categorization response times were more influenced by distance from the reference points in the recognizable than in the non-recognizable morph series.
Although we expected to find directional asymmetries, we did not find them. We assume their absence may be due to the short presentation durations of both stimuli in the pair and the short interstimulus interval used (i.e., 500 ms): given that both stimuli were only briefly presented, and given that none of the stimuli was present when making the comparison, the difference in perceptual presence between the stimuli in the pair may have been too small to be consequential (i.e., too little room for memory effects to be larger for the first than for the second stimulus). Future research could investigate whether the reported results hold for different tasks, stimuli, presentation durations, or interstimulus intervals.
Looking at the results for the morph series watch to seahorse, one might find a mismatch between the lowest discrimination performance and the distinction between within- and between-category pairs. This difference in placement of the category boundary between tasks may be the result of differences in the point of subjective equivalence across participants, as categorization and discrimination data for a particular morph series were collected from different participants. Although the placement of the category boundary was arbitrarily defined based on the collected categorization data, our main results do not depend on the placement of the category boundary. Only the typically reported category boundary effect depends on this placement.
One might notice that, although the predictions for discrimination performance and perceived similarity based on the categorization data follow the observed peaked pattern, the absolute predicted values do not closely match the empirical ones. One potential factor in explaining this divergence is the fact that the data were collected in another task from different participants. More specifically, we would expect categorization to be stronger during the categorization task than when performing the discrimination or similarity judgment task. Before starting the categorization task, participants were presented with four ‘clear’ exemplars per category. Although minimally, these example stimuli inform participants about the categorization of the stimuli and stimulate the use of these categories in their answers. In addition, the categorization task by nature focuses on categorizing the stimuli, potentially improving categorization strength. In the discrimination and similarity judgment task, participants were not informed about this categorization, and were not presented with ‘clear’ exemplars before starting the task. These differences may contribute to a difference in categorization strength for the same morph series across tasks. In addition, more advanced models of discrimination data (e.g., Feldman et al., 2009) include an additional term related to the estimated perceived distance between the stimuli in the pair conditional on the categorization of the stimuli, which could improve absolute prediction performance. Regardless of these differences in absolute values, the typical peaked pattern could be predicted from the categorization data alone, even though these data came from a completely independent task, was collected from different participants per morph series, and the model did not include any information about physical or perceived distance between the stimuli in the pair.
The fact that the tasks were done on different morph series within each participant, and that there was no training before participating in the tasks (except for the four clear exemplars per category shown before starting the categorization tasks), probably contributed to the results for the non-recognizable morph series (they were not categorized as strongly in the categorization task, and the effects in the discrimination and similarity tasks were smaller).
3.4.1 Constraints on generality
This paper puts forward two main results that we expect to generalize to different shape morph series as well as morph series in other stimulus domains (e.g., color, orientation, faces, speech sounds). Firstly, the stronger the categorization for a morph series, the stronger the overall category boundary effect in discrimination performance and similarity judgment. Secondly, for physically equidistant stimulus pairs belonging to morph series that show evidence for categorization, the stimuli in the pair will be perceived as more similar and will be more difficult to discriminate the closer the stimuli in the pair are to one of the reference points. Generalization of the current findings to these other morph series and stimulus domains is however subject to further investigation.
As mentioned earlier, the results in the current study are only directly applicable to settings in which participants have no prior experience with the particular morph series under study. In other words, participants may be able to recognize and categorize shapes correctly without any prior experience, but they should not have had any prior task or prior learning involving the specific stimuli used in the discrimination or similarity judgment task. This constraint on generality is especially important concerning the non-recognizable morph series, as prior experience with the stimuli may lead to implicit categorization and increase categorization strength for these series. Other aspects of the study design important to take into account when assessing its generalizability are the presentation times, intertrial interval durations, and successive presentation format used.
As the current participant sample was a Western European student sample, also generalization to other, especially non-Western participant populations is subject to further investigation. We have no reason to believe that the results depend on other than the above mentioned characteristics of the participants, materials, or context.
3.5 Conclusion
To summarize, we replicated the existence of the category boundary effect in both a successive discrimination and a similarity judgment task, and showed that the strength of the category boundary effect is related to the strength of the reference points involved. The general category boundary effect is not a category boundary effect, however: Although a general category boundary effect results from averaging across physically equidistant stimulus pairs, one needs to take into account distance from the reference points for each of the individual stimuli in the pair to actually predict discrimination performance and similarity judgments. We showed how the observed qualitative pattern of discrimination performance and similarity judgments across stimulus pairs could be predicted by the ‘goodness’ of the individual stimuli in the pair. In other words, in the current study, the qualitative pattern of relative differences in discrimination performance and similarity judgments for physically equidistant stimulus pairs from the recognizable morph series (i.e., the morph series with the clearest reference points) could largely be explained by categorization strength for the individual stimuli alone, and was largely unrelated to the specific stimulus pairs presented. These results provide evidence that the existence and strength of reference points on a stimulus dimension has tangible consequences for how we perceive, categorize, and react to stimuli on that dimension. Moreover, the results remind us of the danger of averaging without looking at the underlying data patterns, and of the gains that can be made by seriously exploring consistent variation in extensive data sets.
3.6 Open and reproducible practices statement
This manuscript was written in R Markdown using the papaja package (Aust & Barth, 2022) with code for data analysis integrated into the text. The data, materials, and analysis and manuscript code for the experiment are available at https://doi.org/10.17605/osf.io/ugcd8.
Often the category boundary effect is also referred to as categorical perception, but here we define categorical perception more broadly as all possible effects of categorization on perception.↩︎
The opposite asymmetry has been found later on, however, and then it was suggested that the differences in asymmetry may have been due to differences in the choice statistics in the different experiments (Best & Goldstone, 2019).↩︎
Wertheimer probably refers to a cognitive grouping (i.e., categorization) in this sentence.↩︎
To start the experiment, participants typed in a counterbalancing number assigned to their seat in the room (numbers were redistributed after each session). This number determined the assignment of the morph series to the different tasks.↩︎
For an overview of all R packages used, see Appendix A.↩︎
Categorization was strongest for recognizable morph series car-tortoise and penguin-child and weakest for non-recognizable morph series 2.↩︎
Categorization was strongest for recognizable morph series car-tortoise and penguin-child and weakest for non-recognizable morph series 2.↩︎
This conclusion touches on some of the conclusions made by McMurray (2022) in the field of speech perception.↩︎
As mentioned earlier, for each morph series the categorization, discrimination, and similarity judgment data were collected from a different subgroup of the participants. The predictions of discrimination performance or perceived similarity based on categorization performance are thus based on data from a different group of participants.↩︎