5 An efficient Bayesian observer model for temporal context effects when perceiving multistable dot lattices
Van Geert*, E., Ivančir*, T., & Wagemans, J. (under review). An efficient Bayesian observer model for temporal context effects when perceiving multistable dot lattices. Preprint available from https://doi.org/10.31234/osf.io/g64fp
* Eline Van Geert and Tina Ivančir contributed equally to this work.
Abstract
In multistable dot lattices, the orientation we perceive is attracted towards the orientation we perceived in the immediately preceding stimulus and repelled from the orientation for which most evidence was present previously (Van Geert et al., 2022). Theoretically-inspired models have been proposed to explain the co-occurrence of attractive and repulsive context effects in multistable dot lattice tasks, but these models artificially induced an influence of the previous trial on the current one without detailing the process underlying such an influence (Gepshtein & Kubovy, 2005; Schwiedrzik et al., 2014). We conducted a simulation study to test whether the observed attractive and repulsive context effects could be explained with an efficient Bayesian observer model (Wei & Stocker, 2015). This model assumes variable encoding precision of orientations in line with their frequency of occurrence (i.e., efficient encoding) and takes the dissimilarity between stimulus space and sensory space into account. An efficient Bayesian observer model including both a stimulus and a perceptual level was needed to explain the co-occurrence of both attractive and repulsive temporal context effects. Furthermore, this model could reproduce the empirically observed strong positive correlation between individuals’ attractive and repulsive effects (Van Geert et al., 2022), by assuming a positive correlation between temporal integration constants at the stimulus and the perceptual level. To conclude, the study brings evidence that efficient encoding and likelihood repulsion on the stimulus level can explain the repulsive context effect, whereas perceptual prior attraction can explain the attractive temporal context effect when perceiving multistable dot lattices.
An efficient Bayesian observer model for temporal context effects
5.1 Introduction
What we perceive is not only influenced by the current stimulus we have in front of our eyes, but also by the recent stimulus and perceptual history. Many recent studies have confirmed the existence of both attractive and repulsive effects of immediate temporal context on perception (Bosch et al., 2020; Fritsche et al., 2020; Pascucci et al., 2019; Sadil et al., 2021; Snyder et al., 2015; Van Geert et al., 2022). Also in the perception of multistable dot lattices, both attractive and repulsive context effects are at play (Gepshtein & Kubovy, 2005; Schwiedrzik et al., 2014; Van Geert et al., 2022). On the one hand, the perceived orientation in these lattices is attracted towards the orientation perceived in the immediately preceding lattice (i.e., hysteresis, attractive effect of previous percept). On the other hand, the perceived orientation is repelled from the orientation for which most evidence was present in the previous lattice (i.e., adaptation, repulsive effect of previous stimulus evidence, Gepshtein & Kubovy, 2005; Schwiedrzik et al., 2014; Van Geert et al., 2022).
Several theoretically-inspired models have been proposed to explain the co-occurrence of these context effects when perceiving multistable stimuli (Gepshtein & Kubovy, 2005; Schwiedrzik et al., 2014), but these models either artificially induce a direct influence of the previous stimulus evidence on the likelihood distribution for the current stimulus (Schwiedrzik et al., 2014) or induce a randomly determined shift in prior bias from the previous to the current percept (Gepshtein & Kubovy, 2005). From these models, it is not clear why such a direct influence would occur, or which underlying process would determine a random shift in bias. In this simulation study, we investigate whether an efficient Bayesian observer model based on Wei & Stocker (2015) can explain the co-occurrence of both attractive and repulsive temporal context effects in multitstable dot lattice perception. Earlier variants of the efficient Bayesian observer model have successfully been used to model effects in different tasks involving non-ambiguous stimuli (Fritsche et al., 2020; Langlois et al., 2021; Wei & Stocker, 2015). In this study, we assess the viability of explaining temporal context effects on multistable dot lattice perception using an efficient Bayesian observer model. As part of this investigation, we test whether the model can not only successfully account for the average temporal context effects observed in Van Geert et al. (2022), but also for the observed range and strong positive correlation of interindividual variation in both effects.
5.1.2 Attractive and repulsive temporal context effects in multistable dot lattice perception
Gepshtein & Kubovy (2005) proposed a paradigm to distinguish between attractive and repulsive context effects on perception. They investigated the influence of (a) the perceived organization of the preceding stimulus (i.e., which organization was reported) and (b) the stimulus support for a certain organization in the preceding stimulus (dependent on the stimulus’ aspect ratio) on the perception of a second, current stimulus, using multistable dot lattices as stimuli.
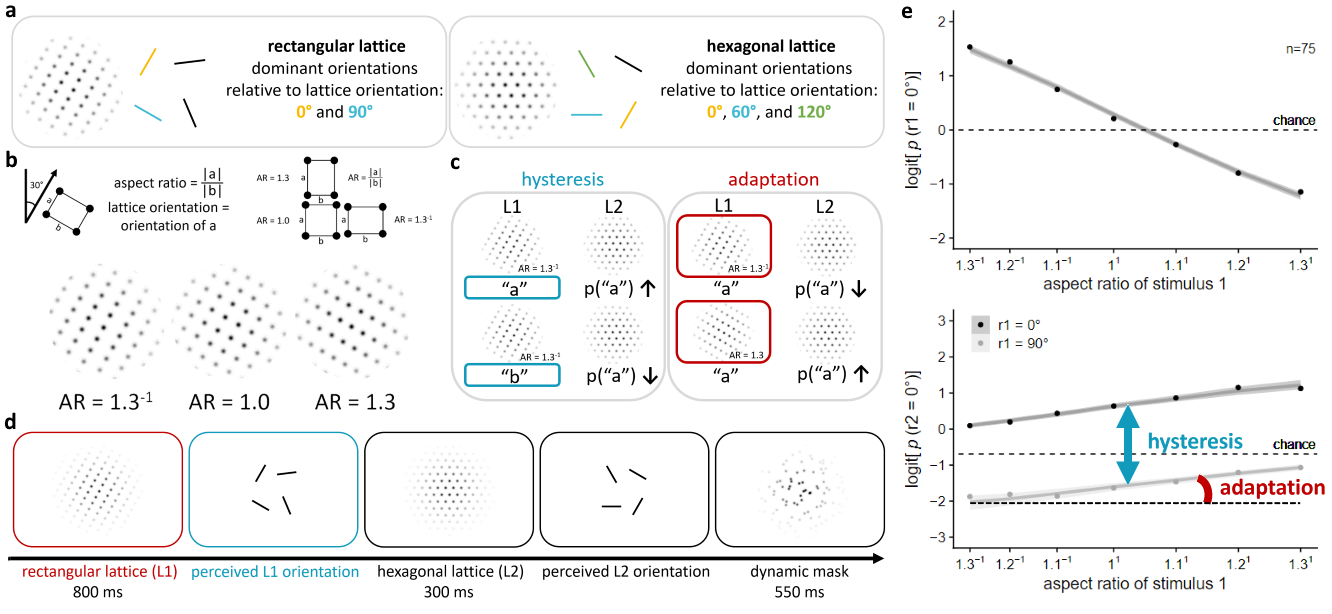
Multistable dot lattices are aligned dot arrays in which multiple orientations can be perceived. In rectangular dot lattices, four different orientations can be perceived (cf. left part of Figure 5.1a), two of which are more prevalent. In hexagonal dot lattices (cf. right part of Figure 5.1a), three equally plausible orientations are most prominent. According to the Gestalt law of proximity (Kubovy et al., 1998), the closer the dots are together along a particular orientation, the more likely they will be grouped together, and consequently, the more likely that orientation will be perceived. Relative grouping strength has been shown to decrease exponentially in accordance with the relative inter-dot distance (Kubovy et al., 1998). For two orientations a and b, the aspect ratio of a dot lattice (AR = |a|/|b|) expresses the a orientation’s relative dominance over the b orientation (cf. Figure 5.1b). For a lattice with AR = 1, the inter-dot distance in the a and b orientations is equal. For a lattice with AR < 1, the inter-dot distance is smaller in the a than in the b orientation. For a lattice with AR > 1, the inter-dot distance is smaller in the b than in the a orientation. In both rectangular and hexagonal dot lattices, we define the axis orientation of the dot lattice as a whole by the a orientation, which we will refer to as the 0° orientation. In the rectangular dot lattices, we will refer to the b orientation as the 90° orientation.
Gepshtein & Kubovy (2005) introduced a multistable dot lattice paradigm to concurrently assess attractive and repulsive immediate temporal context effects on perception, that was later adapted by Schwiedrzik et al. (2014; cf. Figure 5.1d). They used rectangular dot lattices with randomly varying absolute lattice orientation as context stimuli (presented for 800 ms) and more ambiguous hexagonal dot lattices with the same random absolute lattice orientation as test stimuli (presented for 300 ms). Participants indicated which orientation they perceived in each lattice using a four-alternative forced-choice task (always including the most dominant orientations). To manipulate the stimulus support for the 0° orientation, the aspect ratio of the rectangular dot lattice was varied. They then assessed how (a) perceived orientation and (b) aspect ratio in the first, rectangular lattice affected perceived orientation in the second, hexagonal lattice. An attractive (i.e., hysteresis) effect of the previous percept was present, as well as a repulsive (i.e., adaptation) effect of the previous stimulus evidence: the probability of perceiving a particular orientation in the second lattice increased when the same orientation was perceived in the first lattice, and the stronger the evidence for a specific orientation in the first lattice, the lower the probability to perceive that orientation in the second lattice (cf. Figure 5.1c). These results by Gepshtein & Kubovy (2005) and Schwiedrzik et al. (2014) were replicated and extended by Van Geert et al. (2022; cf. Figure 5.1e). Whereas Gepshtein & Kubovy (2005) and Schwiedrzik et al. (2014) mainly explored the existence of these effects on the group level, Van Geert et al. (2022) tested whether individual differences existed in the size of these effects, and whether every individual participant showed both effects in the expected direction. The results confirmed the presence of large, consistent differences in the size of attractive and repulsive context effects across individuals, and these differences stayed stable across one to two weeks time. Furthermore, almost every participant showed both effects in the expected direction, although not every single participant did. As indicated above, the results of Van Geert et al. (2022) provided evidence for at least some common factor underlying both effects, as individual differences in attractive and repulsive context effects were highly positively correlated (cf. Figure 5.9a). Also, hysteresis (i.e., the attractive effect of the previous percept) showed to be a partially percept-related and a partially decision-related effect, nuancing earlier debates on the origin of this effect (Bosch et al., 2020; Cicchini et al., 2017; Fritsche et al., 2017; Manassi et al., 2018; Pascucci et al., 2019; Schwiedrzik et al., 2018).
Now that the existence of both temporal context effects on multistable dot lattice perception has been firmly established, including consistent variation in the size of the effects across individuals, one way forward is to further our understanding of the processes underlying these effects by developing models and verifying whether they can reproduce and explain the range of variability in effect size and direction across individuals. Importantly, a good process model should not only be able to predict a mean response, but also plausible variation in the effect size and direction (Van Geert et al., 2022).
5.1.3 Models of temporal context effects on multistable dot lattice perception
Two earlier models of the multistable dot lattice paradigm for hysteresis and adaptation exist (Gepshtein & Kubovy, 2005; Schwiedrzik et al., 2014). In the model of Gepshtein & Kubovy (2005), combinations of attraction strengths (related to inter-dot distances in the first, rectangular lattice and sensitivity to the inter-dot distance) and a randomly determined persistent intrinsic bias (i.e., a higher probability to perceive some orientation more than others, which stays similar but not identical from first to second lattice) determine the perceived orientation in the second, hexagonal lattice. When the intrinsic bias exceeds the stimulus support (i.e., attraction strength), the multistable lattice is perceived inconsistently with the stimulus support. In this model, the direction of the intrinsic bias is determined randomly, and it is not clear where the bias comes from or which process determines the direction of the bias.
Schwiedrzik et al. (2014) developed a Bayesian model to account for the co-occurrence of hysteresis and adaptation in multistable dot lattice perception. They model both effects independently, with the perceived orientation in the first lattice directly impacting the prior distribution of possible perceived orientations for the second lattice, and the reduction in stimulus support due to neuronal adaptation to the aspect ratio of the first lattice directly impacting the likelihood distribution for the second lattice. In this model, the process behind the direct change in the likelihood is not included and its size is determined arbitrarily.
Based on the model by Wei & Stocker (2015), we propose an alternative Bayesian model that can explain the co-occurrence of hysteresis and adaptation as separate but related processes influencing multistable dot lattice perception. A similar model has been applied by Fritsche et al. (2020) to explain attractive and repulsive stimulus history effects in orientation perception. They did look at the influence of previous stimuli and went more than one stimulus back, but did not distinguish between effects of previous percepts and previous stimulus evidence, and only used non-ambiguous Gabor stimuli.
5.1.4 Efficient Bayesian observer models of perception
A key assumption of an efficient Bayesian observer model is that available coding resources are limited, and that those feature values that occur more frequently will be more accurately encoded or represented (i.e., the principle of efficient coding, Wei & Stocker, 2015). In case of orientation perception, this variable encoding precision will thus lead to frequent orientations being encoded more accurately than less frequent orientations. A second key feature of the model is that it takes the dissimilarity between stimulus space and sensory space into account (as in psychophysics). This leads to differential predictions of adding external stimulus noise, that is, noise related to uncertainty in a specific stimulus feature (e.g., variance in orientation) or internal sensory noise, that is, noise related to uncertainty in encoding and processing (e.g., due to presentation duration, stimulus size, or luminance contrast). Whereas external stimulus noise will only widen the likelihood distribution and increase the overall influence of the prior (leading to stronger prior attraction, ‘Bayesian’ percepts), uniform internal sensory noise will make the likelihood distribution asymmetric in stimulus space and hence create the possibility for biases away from the peak of the prior distribution (i.e., likelihood repulsion, ‘anti-Bayesian’ percepts, Wei & Stocker, 2015). The relative amount of stimulus versus sensory noise will determine which effect will show behaviorally (i.e., attraction or repulsion).
More concretely, frequency of occurrence will jointly influence prior and likelihood in the model. It influences the prior distribution directly: more frequently occurring orientations are also expected to occur more often. However, frequency of occurrence also influences the mapping between stimulus and sensory space: it influences the accuracy with which different orientations will be encoded, and consequently also the width and form with which different orientations will be represented in the likelihood. In other words, the frequency of occurrence will determine the prior distribution as well as how the currently encountered stimulus will be encoded. The stimulus-to-sensory mapping is given by the cumulative density function of the encoding accuracy distribution, and the sensory-to-stimulus mapping is given by the inverse of that cumulative density function.
In the original model, frequency of occurrence was seen on the long term. For example, in most daily environments, cardinal orientations are more prevalent than oblique ones (Coppola et al., 1998; Girshick et al., 2011). In later versions of the model, however, it has been shown that frequency of occurrence can also be defined on the short term, e.g., with the frequency of occurrence changing during the experiment (Fritsche et al., 2020; Ni & Stocker, 2023; Noel et al., 2021). These changes in the frequency of occurrence in the short term may then be used to model short-term temporal context effects on perception.
Fritsche et al. (2020) modeled attractive and repulsive biases of stimulus history using an efficient Bayesian observer model. In this model, they did not disentangle effects of previous stimuli and previous percepts, but treated all effects as related to the previous stimulus evidence. In the empirical study they conducted, they found evidence for short-term attraction and long-term repulsion. When fitting different models to the empirically collected data, a model with distinct transition distributions and different integration time constants for prior and likelihood performed better than a model that used the same parameters for prior and likelihood. In the prior distribution, only the most recently presented stimuli mattered, and updating was fast. In the likelihood distribution, information was integrated over longer timescales, and updates happened more slowly.
In a recent extension of the original model proposed by Wei & Stocker (2015), Mao & Stocker (2022) described perception as a holistic inference process, where the percept of a stimulus is jointly represented at different levels of a representational hierarchy. To adequately model the (variation in) behavioral data of an earlier study (Tomassini et al., 2010), it was necessary to take the higher-level representation into account (i.e., categorization of orientation in this case).
5.1.5 An efficient Bayesian observer model for temporal context effects on multistable dot lattice perception
In this study, we develop an efficient Bayesian observer model for the multistable dot lattices paradigm used by Gepshtein & Kubovy (2005), Schwiedrzik et al. (2014), and Van Geert et al. (2022) to assess hysteresis and adaptation effects. In addition, we investigate how several versions of the model compare to the empirical results obtained by Van Geert et al. (2022). More specifically, we test whether model implementations can explain co-occurring attractive and repulsive context effects, as well as a range of plausible variation in effect size and direction across ‘individuals’ (in this case across simulations with different parameter values). Furthermore, we test whether the model can reproduce a positive correlation between the size of both effects, as was empirically observed in Van Geert et al. (2022).
Different from the original Wei & Stocker (2015) model, we will not (only) implement a long-term orientation prior, but (also) take the short-term context into account: the prior and stimulus-to-sensory mapping for the second lattice will be updated based on the stimulus evidence present for and the percept of the first lattice. Different from the implementation by Fritsche et al. (2020), the model will distinguish attractive influences of the previous percept and repulsive influences of the previous stimulus evidence. Given that a mask was present in the dot lattice paradigm to avoid longer-term context effects, we only take the previous lattice into account and do not model longer-term context influences (different from what was the case in Fritsche et al., 2020). Furthermore, the dot lattice paradigm concerns multistable stimuli resulting in multi-peaked likelihood distributions, whereas previous implementations of the efficient Bayesian observer model focused on non-ambiguous stimuli (e.g., Fritsche et al., 2020; Wei & Stocker, 2015). In sum, our model builds on earlier models but makes at least three innovative contributions.
5.2 Methods
5.2.1 Efficient Bayesian observer model
In this study, we model the perception of two successive dot lattices within one trial of the paradigm. All model simulations were performed in R [Version 4.0.4; R Core Team (2021)].1 All code related to this paper is openly available on the Open Science Framework: https://doi.org/10.17605/OSF.IO/48ESD.
The first lattice is a rectangular dot lattice with varying aspect ratio across trials, the second a hexagonal dot lattice with three equally dominant orientations. First, we develop the model for the percept of the first lattice. Then, we update the prior and stimulus-to-sensory mapping to predict hysteresis and adaptation effects in the perception of the second lattice. In this model, the adaptation effect will be due to efficient encoding and likelihood repulsion on the stimulus level, the hysteresis effect will be due to prior attraction on the perceptual level. Therefore, we will describe this model as hierarchical. The size of the adaptation effect will depend on the relative amount of stimulus noise and sensory noise present, but the size of both context effects will depend mostly on the weights given to the stimulus evidence and percept in the previous trial compared to the long-term context.
5.2.1.1 Perception of the first lattice
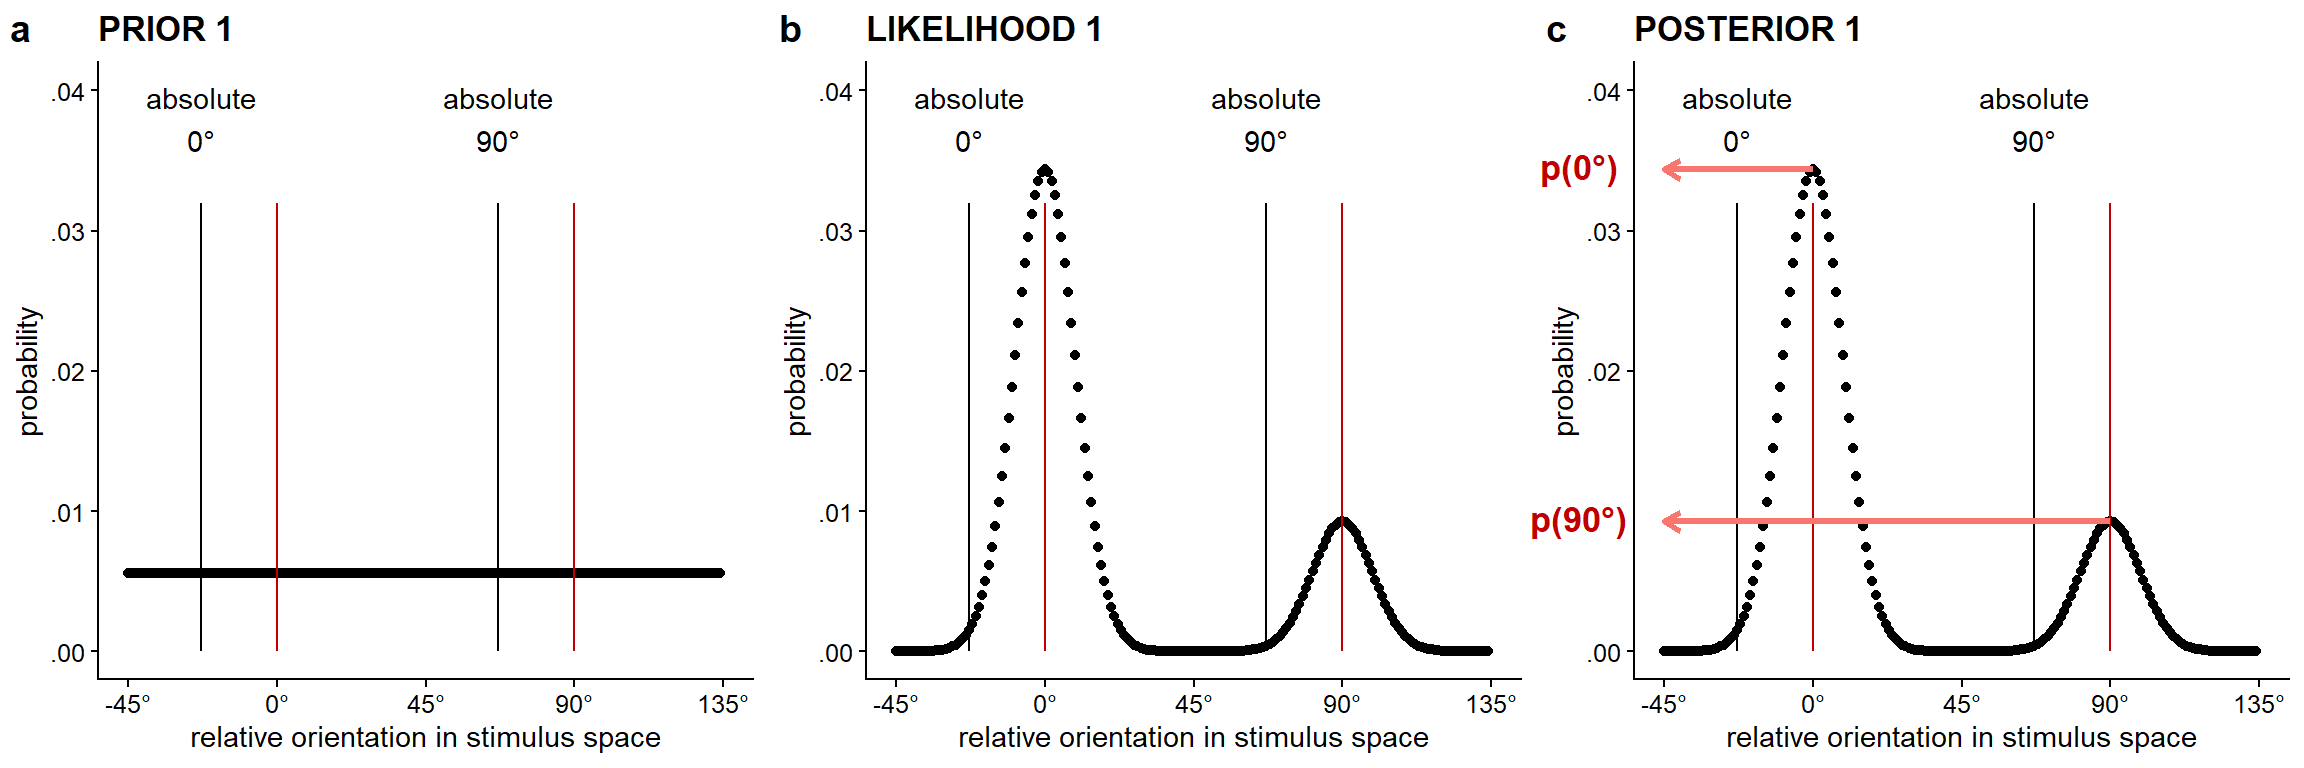
5.2.1.1.1 Prior distribution for the first lattice
In the prior distribution for the first lattice, the long-term stimulus distribution for orientation is represented. We try two variants of the prior. In a first variant, we use the same natural stimulus distribution as in Wei & Stocker (2015): \(p(\theta) = c_0(2 - |sin (\theta)|)\), where \(c_0\) is a normalization constant (cf. Figure C.1a). This natural stimulus distribution reflects the fact that horizontal and vertical orientations are more common in the natural environment than oblique orientations. On the other hand, within the dot lattice paradigm the long-term stimulus distribution is uniform: every absolute lattice orientation occurs equally frequently. Therefore, we implemented a second variant of the model, with a uniform prior distribution for the first lattice (cf. Figure 5.2a). The distribution used in this prior for the first lattice will also affect the stimulus-to-sensory mapping that is used in the calculation of the likelihood distribution for the first lattice.
5.2.1.1.2 Likelihood distribution for the first lattice
Given that the first dot lattice is rectangular, it has two dominant orientations, of which the relative dominance is dependent on the aspect ratio (AR) of the lattice. In case AR = 1, we expect the stimulus support to be equal for both orientations, which will be represented by an equal weight for both likelihood peaks in the distribution. In case AR \(\neq\) 1, one of the peaks will have a stronger representation in the likelihood than the other. To arrive at a double-peaked likelihood distribution (cf. Figure 5.2b), we combine separate von Mises (i.e., circular normal) distributions for both peaks on the 180° (i.e., halfcircular) stimulus orientation space. Both distributions are generated with the same level of stimulus noise, inversely represented with the \(\kappa\)stimL1 parameter (i.e., stimulus precision), but depending on the aspect ratio, the peaks are weighted differently in the mixture distribution. In other words, aspect ratio does not influence the width of the likelihood peaks (i.e., precision \(\kappa\)stimL1), but the relative height or weight of the 0° compared to the 90° likelihood peak. The size of the aspect ratio effect on the relative height of the 0° and 90° peaks is determined by a constant (i.e., \(c\)stim). The level of sensory noise (included in the model as sensory precision: \(\kappa\)sensL1) is assumed to be equal for both distributions.
5.2.1.1.3 Posterior distribution and percept for the first lattice
To arrive at the posterior probability distribution for the perceived orientation of the first lattice (cf. Figure 5.2c), prior and likelihood distributions are combined. From this posterior distribution, the probability of perceiving the relative 0° or 90° orientation can directly be deduced. In case one wants to derive perceptual responses, one of the two dominant orientations can be sampled with the relative posterior probability at these orientations.
5.2.1.2 Perception of the second lattice
5.2.1.2.1 Prior distribution for the second lattice
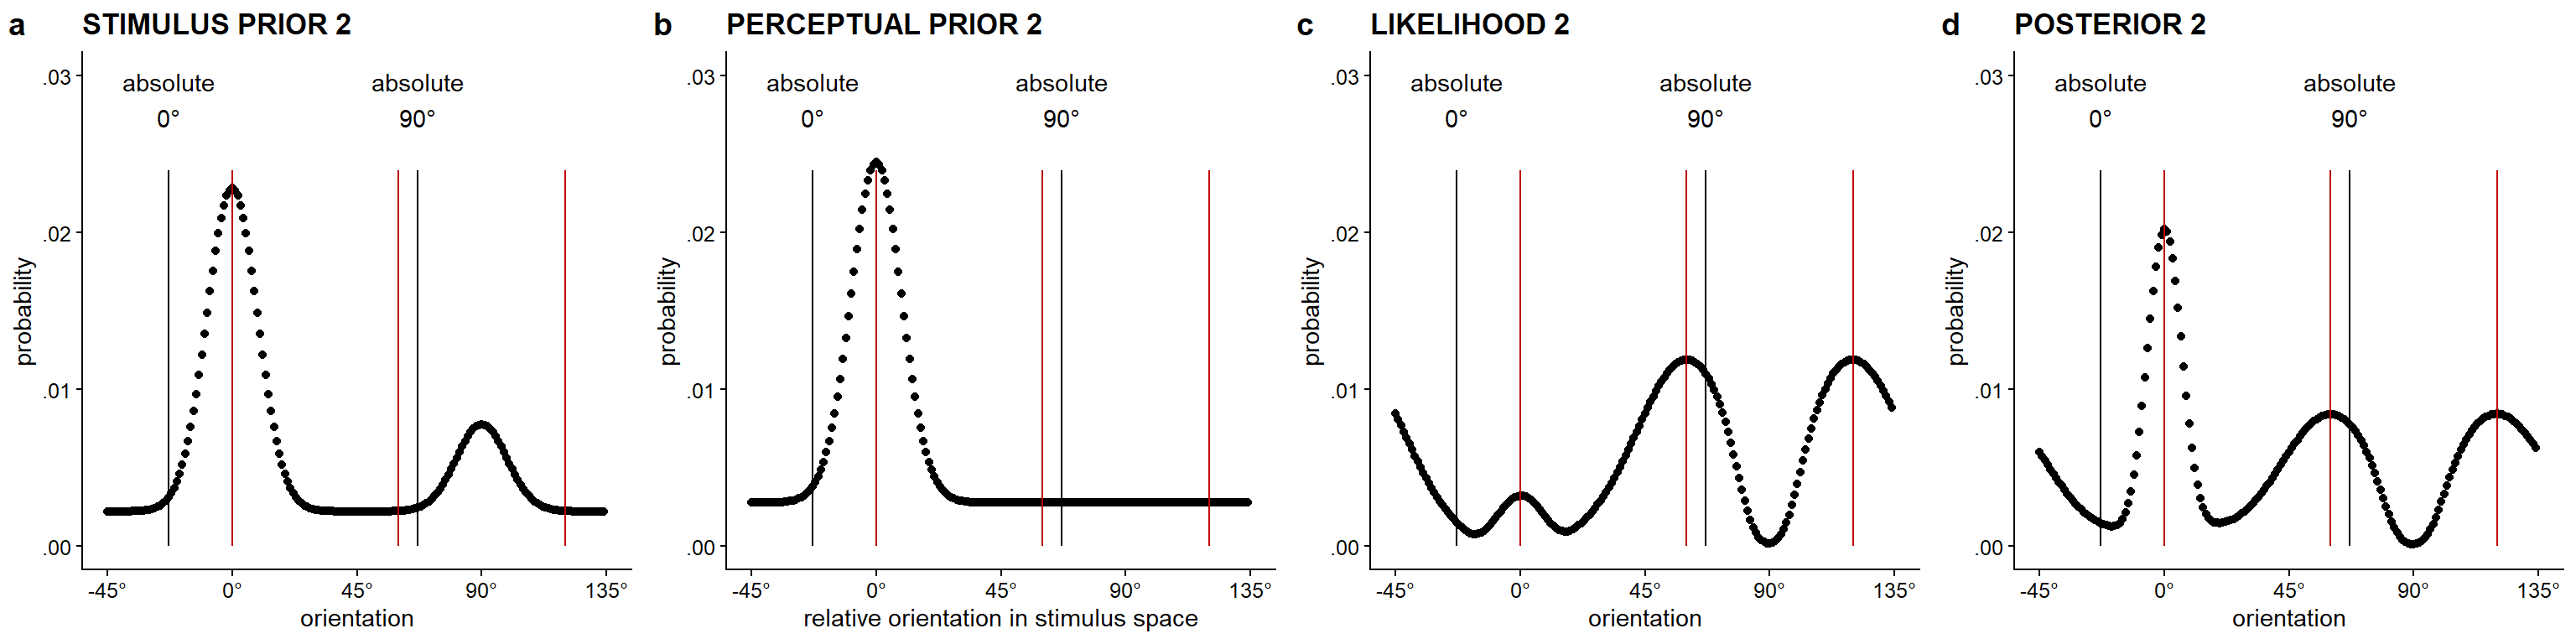
In the current version of the model, we assume two different priors: a stimulus prior affecting the stimulus-to-sensory mapping and a perceptual prior used in combination with the likelihood to form the posterior distribution. A version of the model that used the stimulus prior only could explain the occurrence of adaptation, but not the occurrence of the hysteresis effect.
5.2.1.2.1.1 Stimulus prior for the second lattice
The stimulus prior for the second lattice (cf. Figure 5.3a) is defined as a weighted mixture between the posterior for the first lattice (representing short-term context influences based on the stimulus evidence present) and the prior for the first lattice (representing longer-term context influences of the natural stimulus distribution). If the weight of the posterior compared to that of the prior is increased (i.e., higher \(w\)stimL1), the stimulus prior will update more heavily based on the immediate stimulus history.
5.2.1.2.1.2 Perceptual prior for the second lattice
The perceptual prior for the second lattice (cf. Figure 5.3b) is defined as a weighted mixture between a flat, uniform distribution and a single-peaked von Mises distribution around the perceived orientation of the first lattice. If the weight of the single-peaked von Mises distribution compared to that of the uniform distribution is increased (i.e., higher \(w\)percL1), the perceptual prior will update more heavily based on the immediate perceptual history. Different from the stimulus prior, the perceptual prior thus includes direct information about the percept/decision/response concerning the first lattice. We assume the precision of the single-peaked von Mises distribution part of the perceptual prior (i.e., \(\kappa\)percL1) to be smaller than the stimulus or sensory precision for the second lattice.
5.2.1.2.2 Likelihood distribution for the second lattice
Given that the second dot lattice is hexagonal, it has three equally dominant orientations. Therefore, we assume the stimulus support to be equal for all three orientations, which will be represented by an equal weighting of all three likelihood peaks in the distribution. To arrive at a triple-peaked likelihood distribution (cf. Figure 5.3c), we combine separate von Mises (i.e., circular normal) distributions for all three peaks on the 180° (i.e., halfcircular) stimulus orientation space, based on the stimulus-to-sensory mapping resulting from the stimulus prior distribution for the second lattice. All three distributions are generated with the same level of stimulus precision (\(\kappa\)stimL2). The level of stimulus precision is kept similar to the stimulus precision for the first rectangular lattice. The level of sensory precision (\(\kappa\)sensL2) is also assumed to be equal for all three distributions. Given that the second lattice was presented more briefly than the first lattice (300 ms vs 800 ms), we assume the sensory precision for the second lattice to be lower than the precision for the first lattice.
5.2.1.2.3 Posterior distribution and percept for the second lattice
To arrive at the posterior probability distribution for the perceived orientation of the second lattice (cf. Figure 5.3d), the perceptual prior distribution and the likelihood distribution are combined. From this posterior distribution, the probability of perceiving the relative 0°, 60°, or 120° orientations can directly be deduced. In case one wants to derive perceptual responses, one of the three dominant orientations can be sampled with the relative posterior probability at these orientations.
5.2.2 Free parameters in efficient Bayesian observer model
\(c\)stim influences the strength of the effect of aspect ratio on the relative difference in height between the 0° and 90° peaks in the likelihood distribution for the first lattice. When \(c\)stim is increased, aspect ratio more heavily influences the difference in height for the 0° and the 90° peak in the likelihood distribution for the first lattice.
\(\kappa\)stimL1 (i.e., stimulus precision for the first rectangular lattice) and \(\kappa\)stimL2 (i.e., stimulus precision for the second hexagonal lattice) influence the general precision of the likelihood peaks for the first and the second lattice, respectively. Stimulus precision does not alter the asymmetry of the likelihood distributions in stimulus space. When \(\kappa_{stim}\) is decreased, lower stimulus precision or, in other words, more external stimulus noise is present.
\(\kappa\)sensL1 (i.e., sensory precision for the first lattice) and \(\kappa\)sensL2 (i.e., sensory precision for the second lattice) influence the asymmetry of the likelihood distributions for the first and the second lattice (in stimulus space), respectively. When \(\kappa\)sens is decreased, lower sensory precision or thus more internal sensory noise is present. Given the difference in presentation time (i.e., 800 ms for the first and 300 ms for the second lattice), we assume \(\kappa\)sensL1 to be higher than \(\kappa\)sensL2.
\(w\)stimL1 (i.e., the weight of the posterior of the first lattice on the stimulus prior for the second lattice) determines the relative influence of the short-term effect of the first lattice on the stimulus prior for the second lattice compared to the influence of the long-term natural stimulus distribution.
\(w\)percL1 (i.e., the weight of the percept of the first lattice on the perceptual prior for the second lattice) determines the relative influence of the percept of the first lattice on the perceptual prior for the second lattice compared to a uniform distribution.
\(\kappa\)percL1 (i.e., the precision of the peak for the percept of the first lattice) reflects the precision of the von Mises distribution used in determining the perceptual prior for the second lattice.
To visualize the prior, likelihood, and posterior distributions for one trial under different parameter settings, the reader can try out the Shiny application accompanying this manuscript (cf. Figure C.7).
5.2.3 Model calculations and analyses
To investigate the effect of different model choices and parameters, we calculated the probabilities of perceiving the relative 0° orientation in the first and the second lattice for different versions of the general model described above. For each version of the model that we investigated, we calculated the probabilities for each possible trial, with the trial defined by a combination of the aspect ratio of the first lattice (i.e., 1.3-1, 1.2-1, 1.1-1, 1.0, 1.1, 1.2, 1.3), and the percept of the first lattice (i.e., relative 0° or relative 90° orientation). When using a non-uniform natural stimulus distribution in the prior for the first lattice, we also calculated the probabilities for each absolute lattice orientation (i.e., from 1° to 180° in steps of 1°).2
Our first aim was to find a model and parameter combination that matched well with the average behavioral results found in Van Geert et al. (2022). Once this model version and parameter values was found, we manipulated each of the model parameters separately to investigate their effect on the expected probabilities of perceiving the relative 0° orientation in the first and the second lattice.
Our second aim was to introduce variation in some of the parameter values, to approximate the interindividual variation in effect size and direction found in the behavioral data for the dot lattices paradigm (Van Geert et al., 2022). We varied (a) the constant influencing the relation between aspect ratio and differential height of the 0° and 90° peak in the likelihood for the first lattice (\(c\)stim), (b) the weight of the posterior of the first lattice on the stimulus prior for the second lattice (\(w\)stimL1), and (c) the weight of the percept of the first lattice on the perceptual prior for the second lattice (\(w\)percL1). To investigate whether we could reproduce the strong positive correlation between individuals’ hysteresis and adaptation effects found in Van Geert et al. (2022), we drew 75 individual parameter combinations for \(c\)stim, \(w\)stimL1, and \(w\)percL1 from a truncated multivariate normal distribution with means 5, 6.5, 5, a lower boundary of zero for all three parameters, an upper boundary of 10 for \(w\)stimL1 and \(w\)percL1, and the following variance-covariance matrix: \(\begin{bmatrix} 25 & 0 & 0 \\ 0 & 9 & 8.95 \\ 0 & 8.95 & 9 \end{bmatrix}\). The \(w\)stimL1 and \(w\)percL1 parameters were then rescaled with a maximum of one instead of ten to match the zero-to-one range. We then calculated the probabilities of perceiving the relative 0° orientation in the first and the second lattice for all 75 parameter combinations and calculated the expected frequencies of each response given those probabilities.
To compare the variation in hysteresis and adaptation effects in the models to the variation in the behavioral results from Van Geert et al. (2022), and also to compare the observed correlation between individual hysteresis and adaptation effects, we conducted similar Bayesian analyses as in Van Geert et al. (2022) to the simulated data. More specifically, we estimated individual hysteresis and adaptation effects using a Bayesian multilevel binomial regression model predicting the percept of the second lattice, with aspect ratio of the first lattice (\(AR\)) and the percept of the first lattice (\(R10\)) as fixed and random effects. To estimate the direct proximity effect, we used a Bayesian multilevel binomial regression model predicting the percept of the first lattice, with aspect ratio of the first lattice (\(AR\)) as fixed and random effect. For more details on these Bayesian analyses, please consult Appendix C as well as Van Geert et al. (2022).
5.3 Results
5.3.1 Approximation of average attractive and repulsive temporal context effects
After exploration of several parameter combinations, we were able to approximate the average behavioral results of Van Geert et al. (2022) with both a uniform (cf. Figure 5.4a) or a natural stimulus distribution prior for the first lattice (cf. Figure C.3) and the following parameter values: \(c\)stim = 5, \(\kappa\)stimL1 = 20, \(\kappa\)sensL1 = 20, \(\kappa\)stimL2 = 20, \(\kappa\)sensL2 = 18, \(\kappa\)percL1 = 10, \(w\)stimL1 = 0.60, and \(w\)percL1 = 0.50. Whether a uniform prior distribution or a natural stimulus distribution was used as prior for the first lattice did not visibly influence the results.
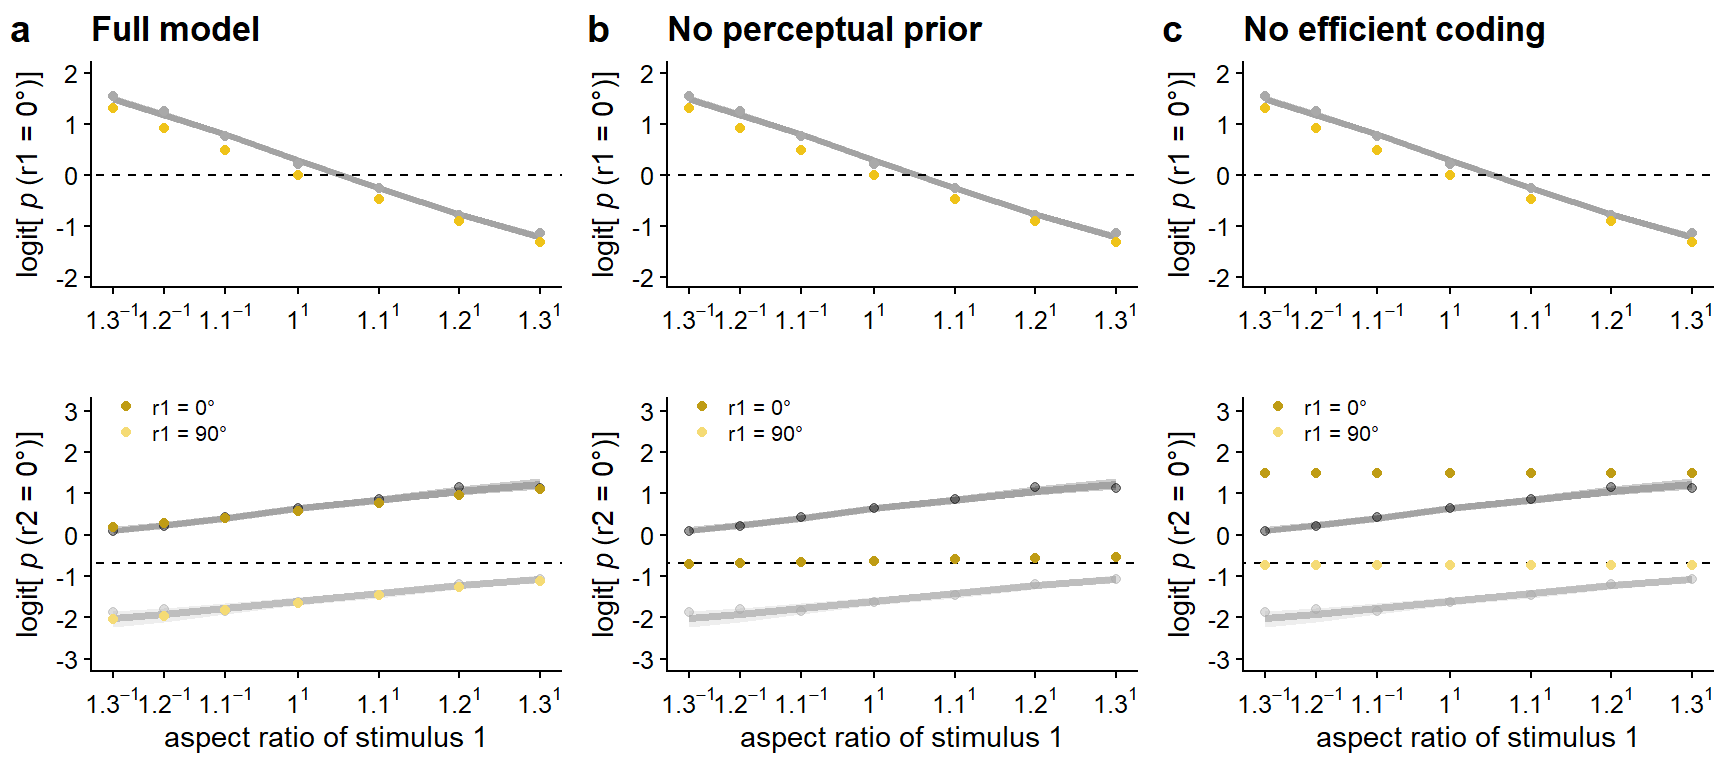
A version of the model using the stimulus prior in combination with the likelihood for the second lattice instead of the perceptual prior was able to predict a repulsive context effect of the previous stimulus evidence, but not the attractive effect of the previous percept (cf. Figure 5.4b). Although the predicted repulsive effect is only weak in this particular version, this is a consequence of the parameter settings: as in this version of the model, the same distribution is used in the prior (resulting in prior attraction) and in the likelihood (resulting in likelihood repulsion), and \(w\)stimL1 and \(w\)percL1 are almost equal, attractive and repulsive effects largely cancel each other out. If \(w\)stimL1 is increased and \(w\)percL1 is decreased, a stronger repulsive effect is visible (cf. Figure C.4).
Is efficient encoding necessary to reproduce the behavioral results? A version of the model without efficient encoding was able to predict an attractive context effect of the previous percept (as the perceptual prior was still combined with the likelihood for the second lattice), but not the repulsive effect of the previous stimulus evidence, as that effect depends on the impact of the first lattice on the stimulus-to-sensory mapping and the likelihood of the second lattice (cf. Figure 5.4c).
5.3.2 Effects of free parameters on attractive and repulsive temporal context effects
Here we start from the final efficient Bayesian observer model with a uniform prior for the first lattice and the parameters specified above and explore the effect of each parameter separately on the expected probabilities of perceiving the relative 0° orientation in the first and the second lattice. Under these settings, \(c\)stim is the only parameter influencing the size of the direct proximity effect (i.e., the effect of aspect ratio on the percept of the first lattice; cf. Figure 5.5a). Through its influence on the likelihood for the first lattice, \(c\)stim also indirectly influences the size of the repulsive context effect of aspect ratio on the second lattice (cf. Figure 5.6a).
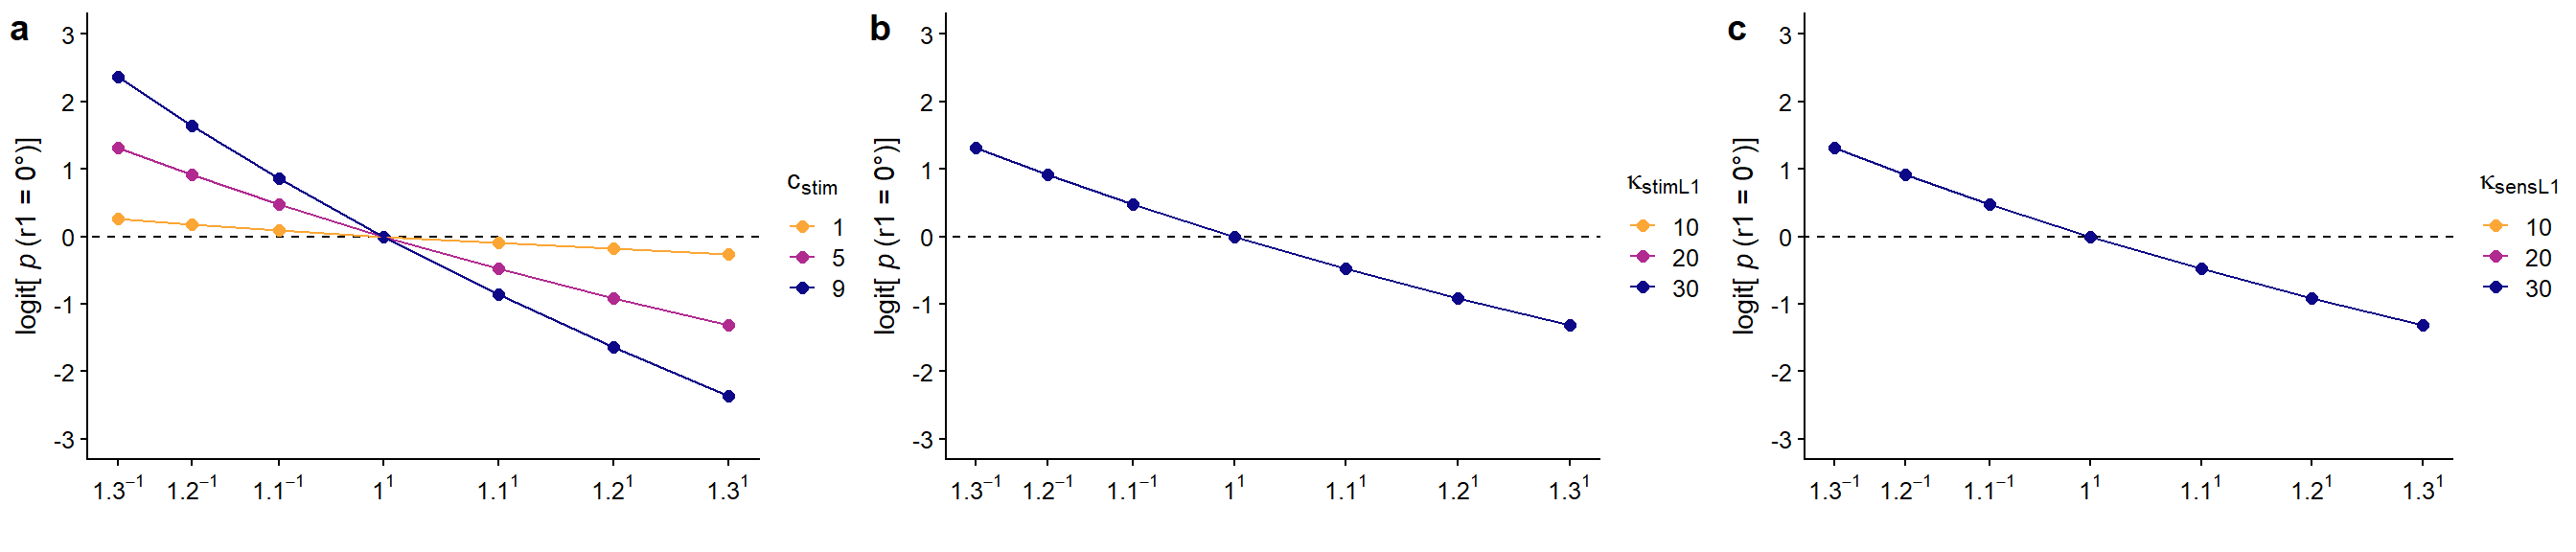
As \(\kappa\)stimL1 only lowers overall precision of the likelihood distribution for the first lattice (which increases the influence of the prior on the posterior) and a uniform prior distribution is used, a change in \(\kappa\)stimL1 does not have an influence on the relative posterior probabilities for the 0° and 90° orientation in the first lattice. Therefore, \(\kappa\)stimL1 does not influence the size of the proximity effect in case a uniform prior is used for the first lattice (cf. Figure 5.5b). In the expected probabilities for the second lattice, a higher stimulus precision for the first lattice (i.e., \(\kappa\)stimL1) results in slightly lower probabilities of perceiving the relative 0° orientation in the second lattice, especially for lower aspect ratios (i.e.., in favor of the relative 0° orientation). In other words, a higher \(\kappa\)stimL1 thus results in a slightly stronger repulsive effect of the previous stimulus evidence (cf. Figure 5.6b).
Given a uniform prior distribution, also \(\kappa\)sensL1 does not influence the relative posterior probabilities for the 0° and 90° orientation in the first lattice. In other words, \(\kappa\)sensL1 does not influence the size of the proximity effect in case a uniform prior is used for the first lattice (cf. Figure 5.5c). In the expected probabilities for the second lattice, a higher sensory precision for the first lattice (i.e., \(\kappa\)stimL1) results in a slightly stronger repulsive effect of the previous stimulus evidence (cf. Figure 5.6c).
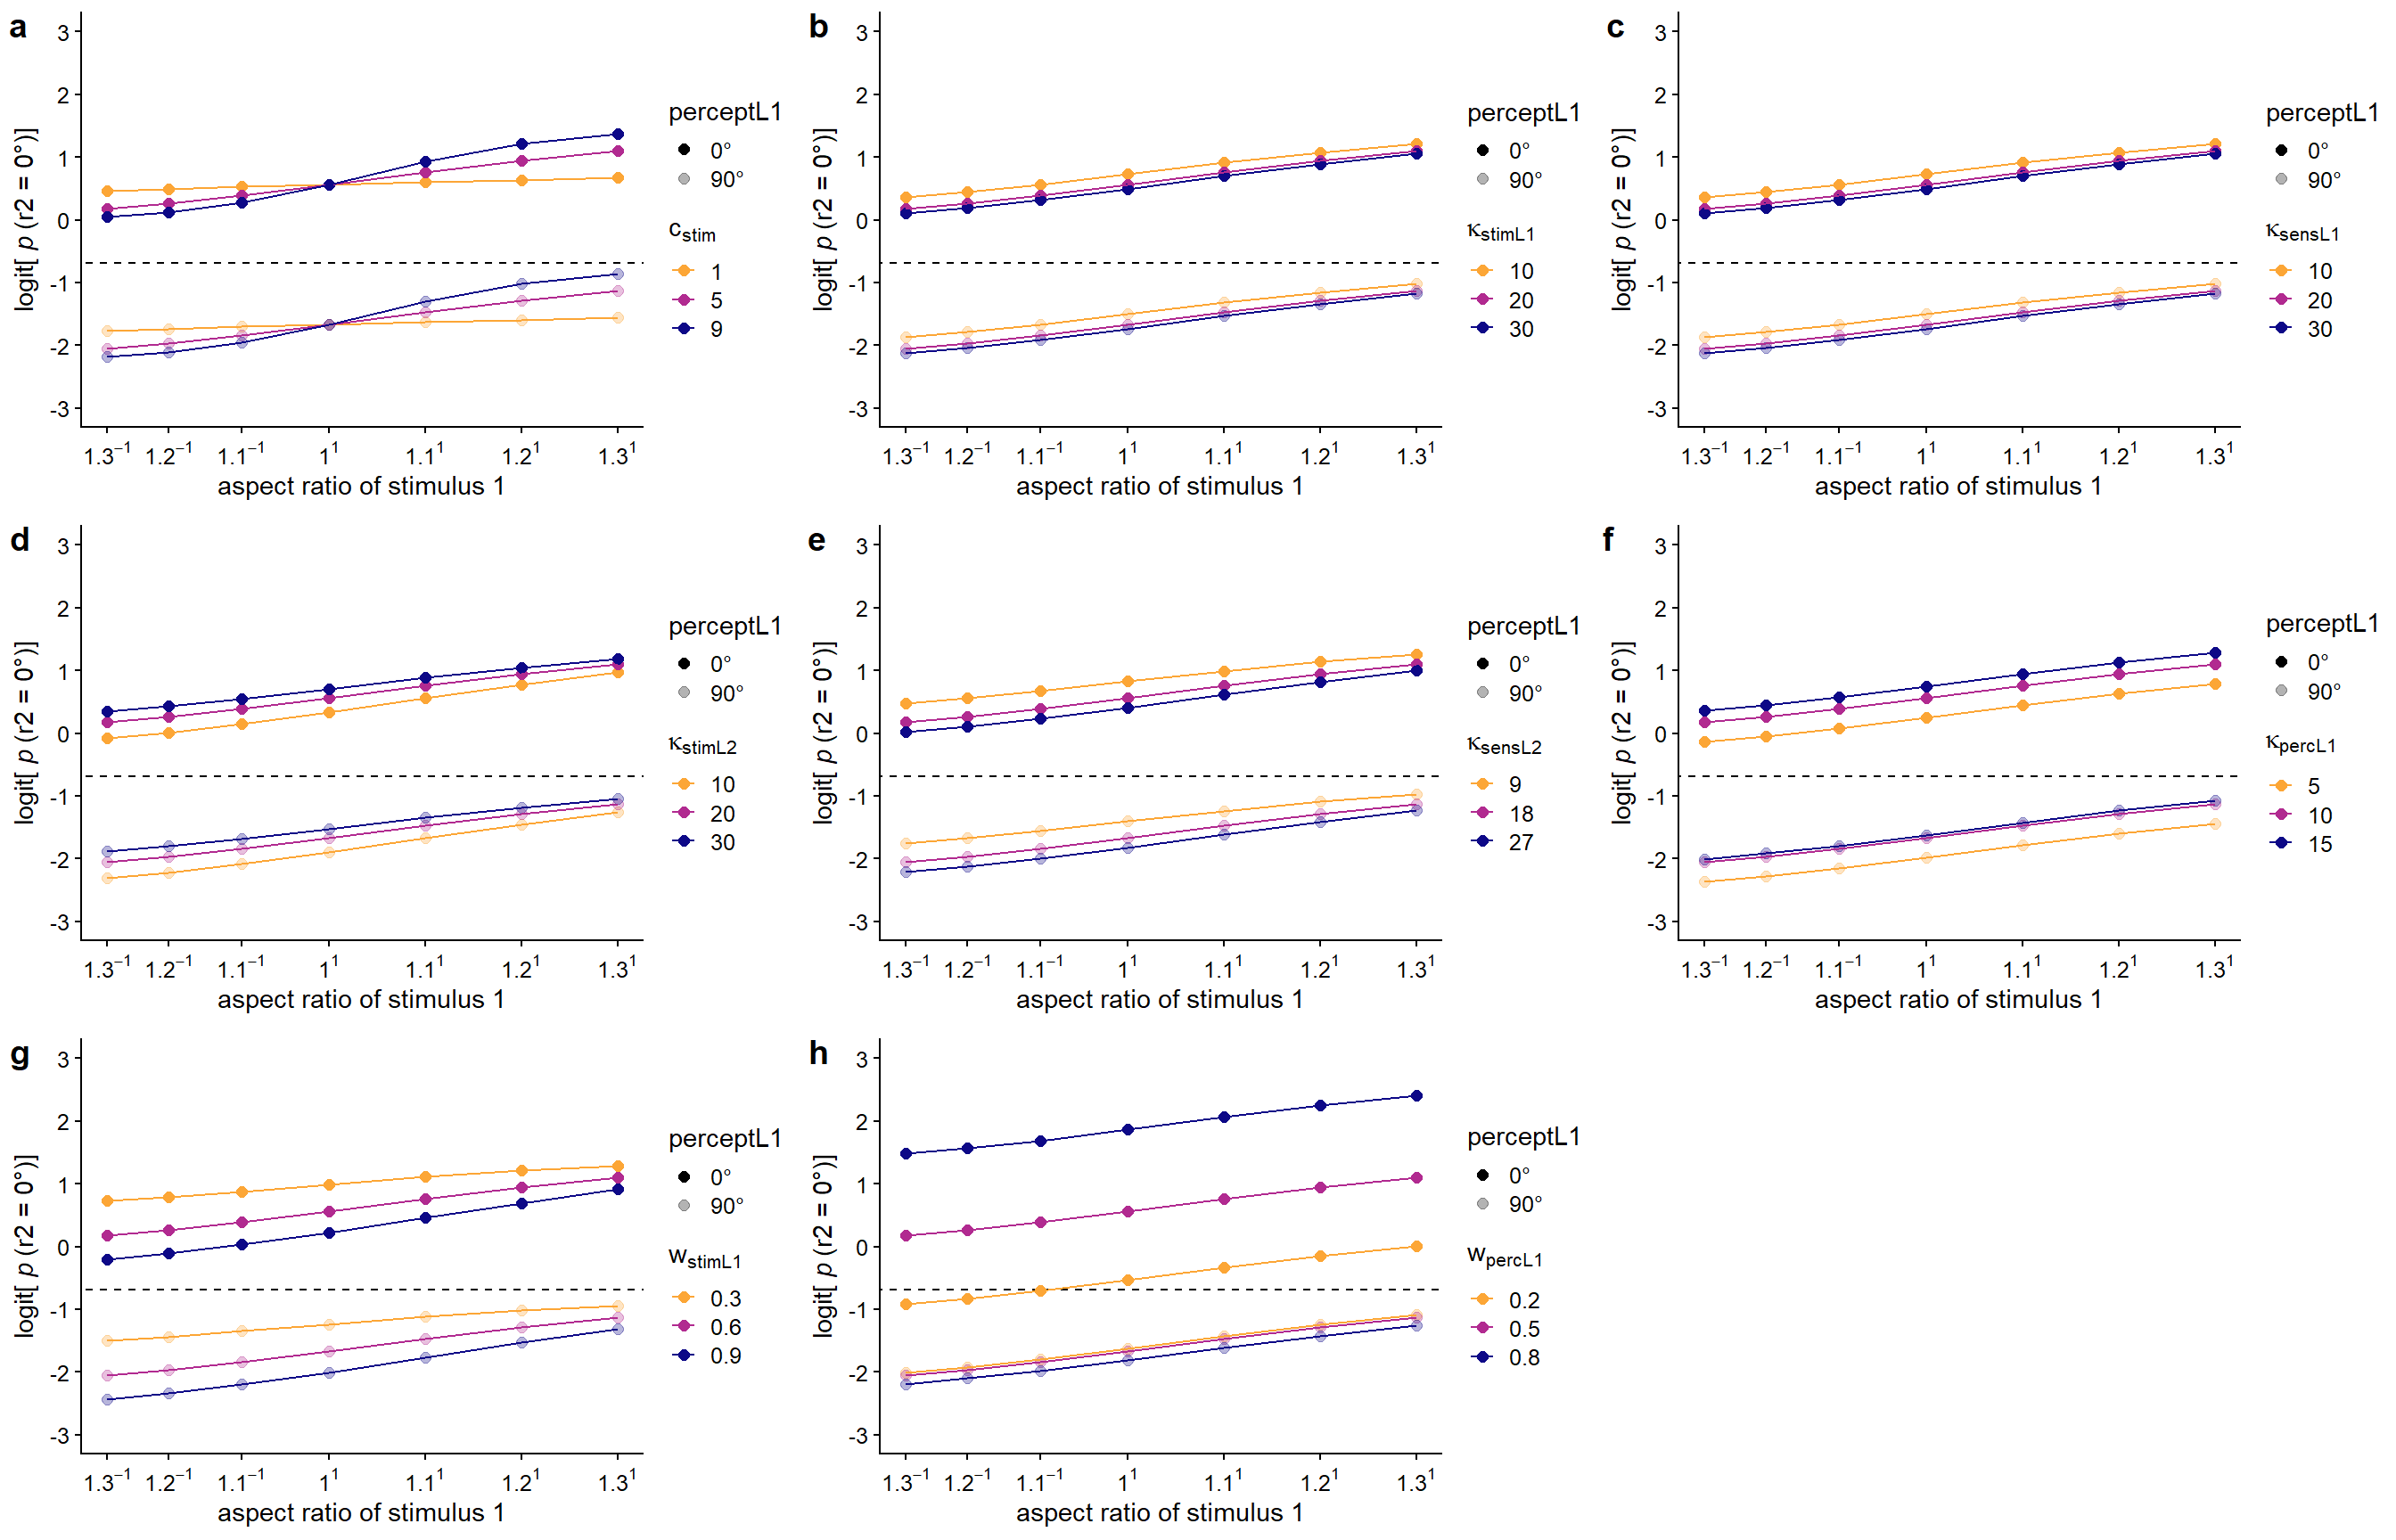
As can be seen in Figure 5.6d, increasing \(\kappa\)stimL2 slightly increases the expected probabilities for perceiving the 0° orientation in the second lattice overall, but more so for lower aspect ratios. Hence, a higher \(\kappa\)stimL2 results in a slightly shallower adaptation effect (i.e., repulsive effect of the previous stimulus evidence). Increasing \(\kappa\)sensL2 leads to the opposite effect (cf. Figure 5.6e): the higher the sensory precision for the second lattice, the stronger the adaptation effect.
The more precise the peak in the perceptual prior for the second lattice, the higher the overall probability of perceiving the relative 0° orientation in the second lattice. Although the effect of \(\kappa\)percL1 is present regardless of the percept for the first lattice being the relative 0° or the relative 90° orientation, the effect of \(\kappa\)percL1 is larger for conditions in which the relative 0° orientation was perceived in the first lattice (cf. Figure 5.6f).
Increasing the weight of the previous stimulus evidence compared to the long-term uniform stimulus distribution (i.e., \(w\)stimL1) increases the size of the adaptation effect (cf. Figure 5.6g). Increasing the weight of the previous percept compared to the long-term uniform perceptual history (i.e., \(w\)percL1) increases the size of the hysteresis effect (cf. Figure 5.6h).
5.3.3 Interindividual variation in proximity, hysteresis, and adaptation
When introducing interindividual variation in the parameter values for \(c\)stim, \(w\)stimL1, and \(w\)percL1, interindividual variation in proximity, hysteresis, and adaptation effects results. With the currently used parameter combinations, the size of the hysteresis and adaptation effects varied less in the simulation data than in the empirical data, but the simulated variation is plausible given the empirical data (cf. Figure 5.7 for average results and Figure 5.8 for individual simulation results). Furthermore, the same relation between hysteresis and adaptation effects is visible as in the empirical data: By generating \(w\)stimL1 and \(w\)percL1 in a positively correlated manner, we were able to reproduce the empirically found positive correlation between individuals’ attractive and repulsive temporal context effects (cf. Figure 5.9b). Different from the empirical results in Van Geert et al. (2022), the adaptation effect showed a strong negative correlation with the direct proximity effect in the simulation results and the hysteresis effect showed no correlation with the direct proximity effect (cf. Figure C.6).


5.4 Discussion and conclusions
We tested whether the observed attractive and repulsive temporal context effects could be explained by an efficient Bayesian observer model (Wei & Stocker, 2015), which has previously been successfully applied to many different study designs involving non-ambiguous stimulus perception (e.g., Fritsche et al., 2020; Langlois et al., 2021; Wei & Stocker, 2015). The efficient Bayesian observer model assumes variable encoding precision of orientations in line with their frequency of occurrence (i.e., efficient encoding) and takes the dissimilarity between stimulus space and sensory space into account, which leads to asymmetric likelihood distributions as a result of uncertainty induced by internal sensory noise, and consequently the possibility for ‘anti-Bayesian’ percepts biased away from the observer’s prior beliefs.
A hierarchical efficient Bayesian observer model including both a stimulus and a perceptual level was needed to explain the co-occurrence of both attractive and repulsive temporal context effects. The aspect ratio of the first lattice (i.e., the previous stimulus evidence) affected the percept of the second lattice via the stimulus-to-sensory mapping (i.e., efficient encoding) and the likelihood (i.e., likelihood repulsion) of the second lattice. The previous percept affected the perceptual prior for the second lattice and as a consequence the posterior probability of perceiving the relative 0° orientation in the second lattice (i.e., prior attraction). In other words, efficient encoding and likelihood repulsion on the stimulus level could explain the repulsive context effect, whereas perceptual prior attraction could explain the attractive temporal context effect when perceiving multistable dot lattices. This reasoning was confirmed based on simulations from model variants without efficient coding (showing only hysteresis) and without a perceptual prior (showing only adaptation). The conclusion that a hierarchical model including both a stimulus and a perceptual level is needed, is in line with Mao & Stocker (2022), who suggested the need to take higher-level representations into account to adequately model human subjects’ orientation percepts.
Not only the mean attractive and repulsive temporal context effects present in Van Geert et al. (2022) could be reproduced using a hierarchical efficient Bayesian observer model, also plausible variation in effect size and direction could be derived by varying (a) the constant influencing the relation between aspect ratio and differential height of the 0° and 90° peak in the likelihood for the first lattice (\(c\)stim), (b) the weight of the posterior of the first lattice on the stimulus prior for the second lattice (\(w\)stimL1), and (c) the weight of the percept of the first lattice on the perceptual prior for the second lattice (\(w\)percL1). Furthermore, the hierarchical efficient Bayesian observer model could reproduce the empirically observed strong positive correlation between individuals’ attractive and repulsive effects (Van Geert et al., 2022), by assuming a positive correlation between temporal integration constants at the stimulus and the perceptual level. That is, individuals who weight the previous stimulus evidence more highly in relation to the long-term stimulus context will also weight the previous percept more highly in relation to the long-term perceptual context than individuals who weight the previous stimulus evidence less highly. Different from the successful reproduction of the high positive correlation between attractive and repulsive temporal context effects, the correlations between the temporal context effects and the direct proximity effect did not match those observed in the empirical data. Follow-up research may aim to find parameter combinations that provide a closer match to those aspects of the empirical data.
Whereas earlier models induced a direct effect of the previous stimulus evidence on the likelihood distribution for the second lattice (Schwiedrzik et al., 2014), or posited a persistent bias for an absolute orientation but did not model the origin of the bias (Gepshtein & Kubovy, 2005), the current efficient Bayesian observer model provides a more complete process model of how previous percept and stimulus evidence can influence multistable dot lattice perception. We consider changes in the frequency of occurrence (in this case on the short term) and consequently in the prior distribution and the stimulus-to-sensory mapping a conceptually plausible explanation for the co-occurrence of separate but related short-term attractive and repulsive temporal context effects. The currently proposed model thus integrates explanations for both mechanisms in one coherent (hierarchical) theory, which was not the case in the earlier models of the dot lattice paradigm (Gepshtein & Kubovy, 2005; Schwiedrzik et al., 2014). Assuming separate but related processes underlying both context effects present at multiple hierarchical levels (i.e., likelihood repulsion on the stimulus level and prior attraction on the perceptual level, related through their dependence on the posterior for the first lattice), provides an intermediate position, in between researchers positing one single mechanism underlying both effects and researchers confirming differences in the characteristics of both effects. Furthermore, the idea of separate but related processes inherent in the efficient Bayesian observer model is highly compatible with the empirically observed high correlation between individuals’ attractive and repulsive temporal context effects as observed in Van Geert et al. (2022).
It is highly likely that our visual system takes more previous stimulus evidence or percepts into account than only one stimulus back. Another possible follow-up is therefore to take changes throughout the entire experiment into account when modeling the behavioral data resulting from the multistable dot lattice paradigm. However, the presence of a mask in between trials makes modeling this process conceptually more complex. Furthermore, when modeling the results for the current paradigm, going only one trial back, was enough to replicate the behavioral effects. It was thus not necessary to go more than one trial back to successfully account for the co-occurrence of both effects.
The current computational model can serve to inspire new experimentation. The model can generate quantitative predictions that can be tested in new experiments: for example, sensory noise can be manipulated using exposure time or stimulus contrast, the alignment of the dots in the lattice can be decreased to lower stimulus precision, or a longer inter-stimulus interval could be introduced to weaken the influence of the first lattice. Also, the same modeling approach can be adapted to other tasks measuring temporal context effects with different multistable stimuli.
To conclude, a hierarchical efficient Bayesian observer model including both a stimulus and a perceptual level can explain repulsive temporal context effects in multistable dot lattice perception via efficient encoding and likelihood repulsion, and attractive effects via perceptual prior attraction. This conclusion is in line the conclusion of Mao & Stocker (2022), who suggested the need for considering the complex hierarchical structure of the brain, by also taking the higher-level representation into account to adequately model human subjects’ response behavior.
5.5 Open and reproducible practices statement
This manuscript was written in R Markdown using the papaja package (Aust & Barth, 2022) with code for data analysis integrated into the text. The data, materials, and analysis and manuscript code for the experiment are available at https://doi.org/10.17605/osf.io/48esd.
For an overview of all R packages used, see Appendix C.↩︎
When using a uniform prior distribution for the first lattice, the absolute lattice orientation does not influence the posterior probabilities for the first or the second lattice.↩︎